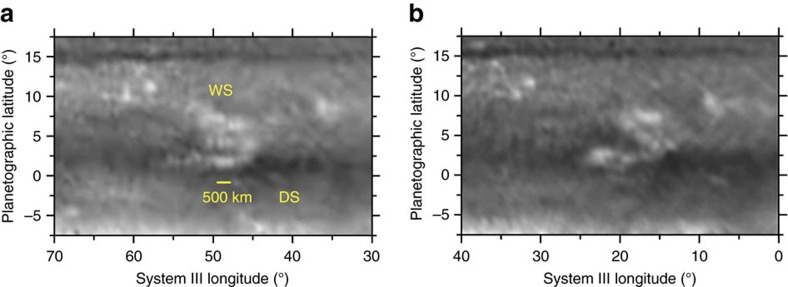
Figure 4. Morphology of the white spot and dark spot.
Morphology and changes in the white (WS) and dark (DS) spots as observed with the HST-WFC3 at a wavelength of 750 nm in images separated by 20.6 h on: (a) 29 June and (b) 30 June. Image details are given in Supplementary Table 2.

