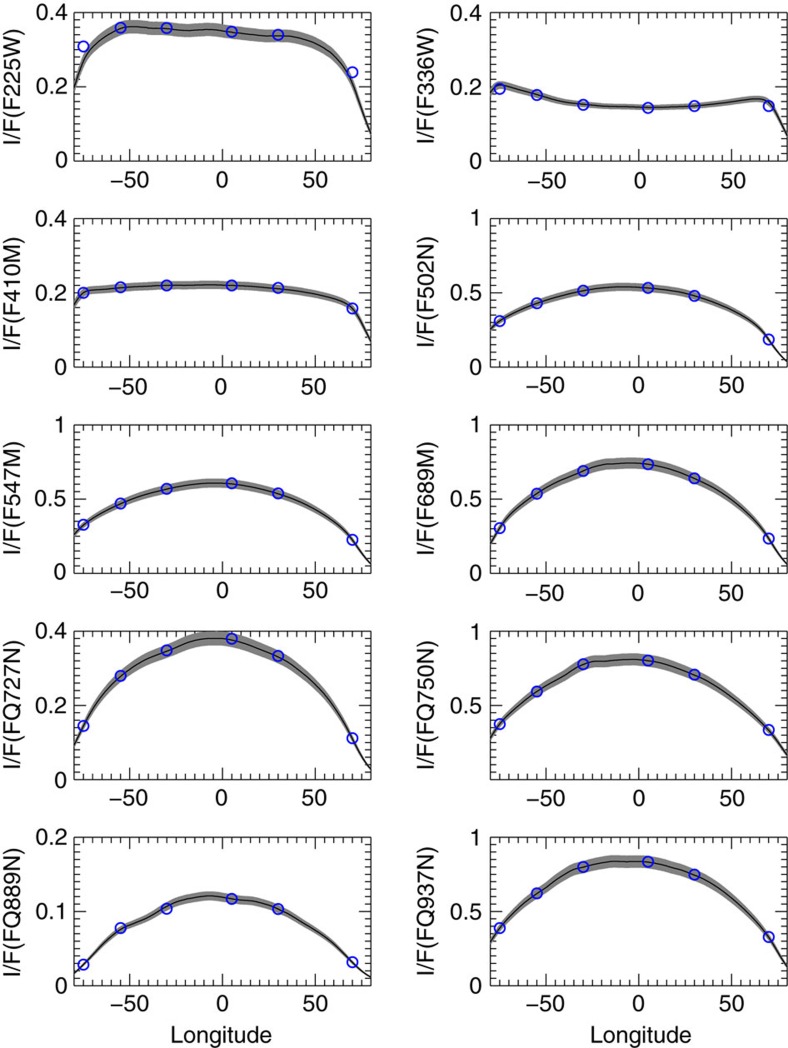
Figure 6. Radiative transfer models compared with the observed reflectivity.
Best-fitting model (blue dots) of the Equatorial Zone center to limb variation of the absolute reflectivity I/F for all HST filters listed in Table 1. The solid lines (with shadowed uncertainties) represent the observed reflectivity and were obtained after smoothing every 1° in longitude to remove particular features from the modelling. Error bars show the 5% confidence level resulting from a number of uncertainty sources33,34.

