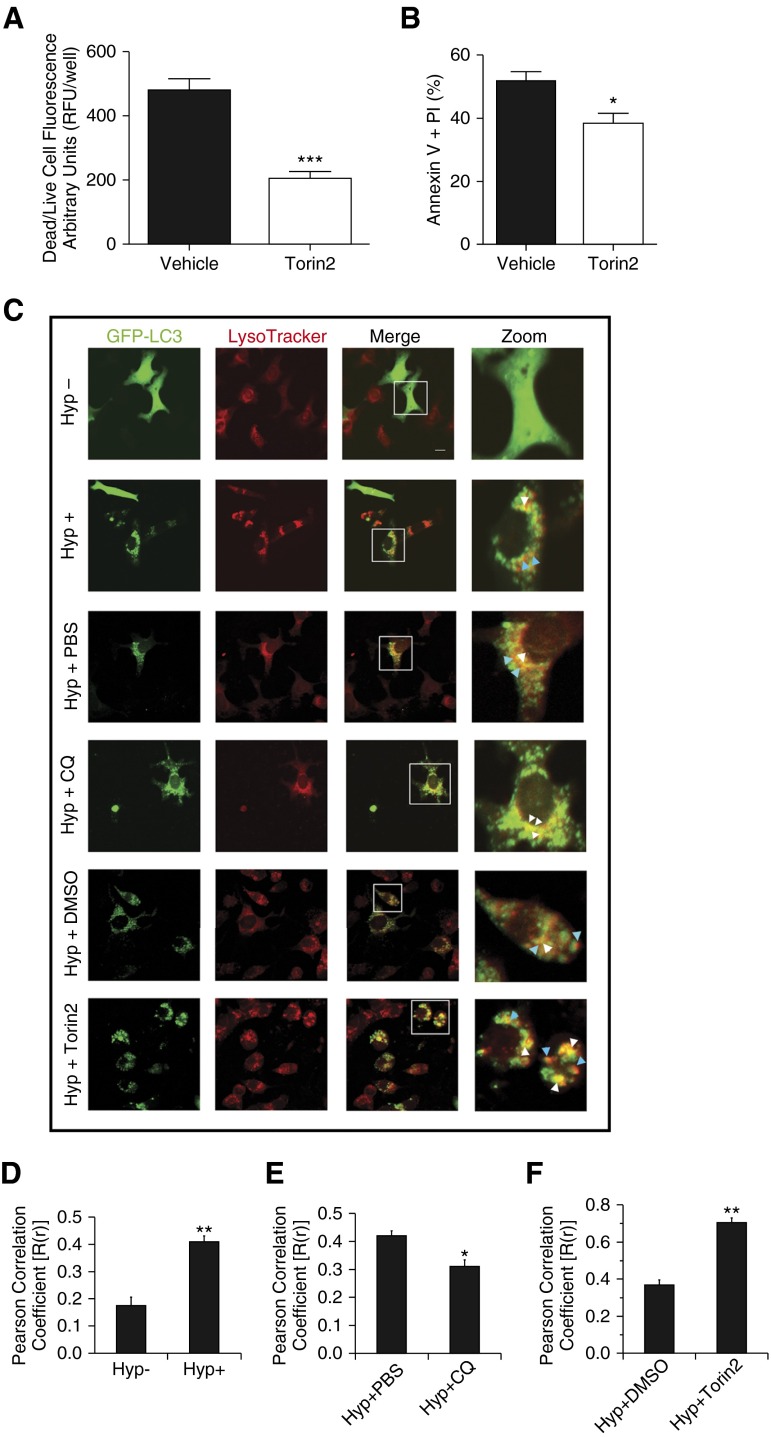
Figure 3.
Effect of Torin2 on hyperoxia-induced acute lung injury. (A) MLE-12 cells were treated with or without Torin2, exposed to hyperoxia, and dead/live cell fluorescence assay was performed at 24 hours. Quantitative analysis showing significantly decreased dead/live cell fluorescence in the Torin2-treated group compared with control vehicle-treated group (0.1% DMSO) at 24 hours. (B) MLE-12 cells were treated with or without Torin2, exposed to hyperoxia, and subjected to annexin V and PI assay. Flow cytometric quantitative analysis showing significantly decreased annexin V– and PI-positive MLE-12 cells of the Torin2-treated group compared with control vehicle-treated group (0.1% DMSO). (C) MLE-12 cells transiently expressing green fluorescent protein (GFP)-LC3 were treated with or without CQ (25 μM) and Torin2 (100 nM) and exposed to hyperoxia for 16 and 24 hours, respectively. Formation of acidic vesicular organelles was monitored by LysoTracker deep-red staining, and representative images were obtained using confocal microscopy. Merge panel shows the colocalization of punctate GFP-LC3 and LysoTracker staining. Representative LC3-positive early (yellow) and late (red) autolysosomes were enlarged and marked with arrows. White arrows indicate yellow puncta; blue arrows indicate red puncta. Scale bar, 20 μm. (D–F) Colocalization was quantified by counting more than 30 cells using Pearson correlation coefficient, and values are represented as means ± SEM of three independent experiments. *P < 0.05, **P < 0.01, ***P < 0.001, compared with respective controls.

