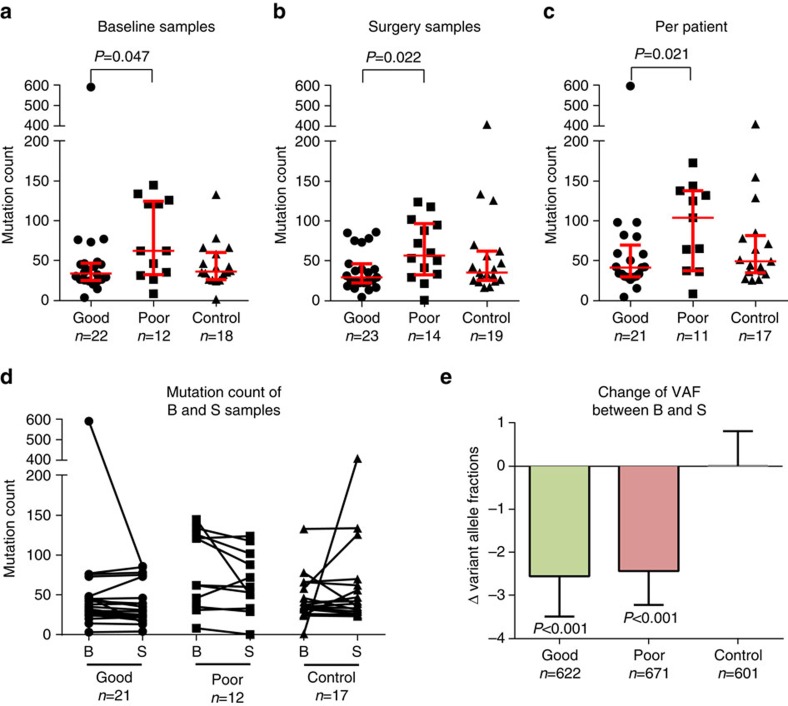
Figure 2. Differences of mutation counts and treatment effects.
Analysis on the mutation load of samples with exome-wide mutation profile from phase I. (a–b) Poor responder showed significantly more mutations than good responder on baseline (B) and surgery (S). (c) Also the number of mutations on a per-patient basis (mutations from B and S samples combined, counting identical mutations once only) was significantly higher in poor responders. Median and interquartile ranges are shown as bars. (d) No significant difference between the B and S mutation counts within responder groups between each of the 49 paired samples. (e) Good and poor responders showed a significant, but low reduction of the mean variant allele fractions (VAFs) of single-nucleotide variants between B and S. Whiskers show 95% confidence interval. Significance was tested by Mann–Whitney test.

