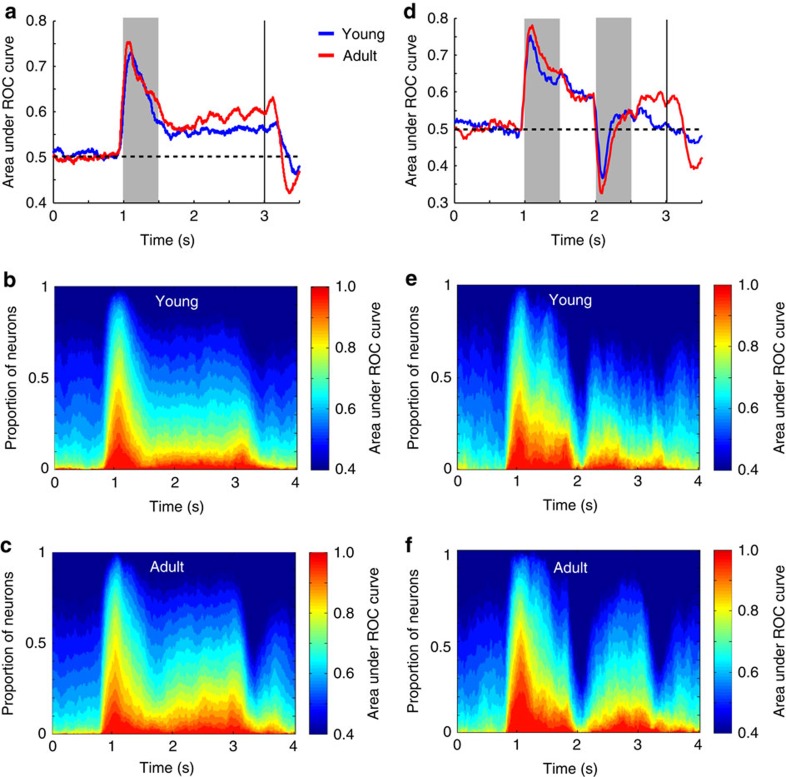
Figure 3. ROC analysis in working memory tasks.
(a) Area under ROC curve in successive 250 ms windows is plotted as a function of time during the ODR task, for the young (average of n=309 neurons) and adult stage (n=324). (b) Percentage of neurons in the young age reaching different levels of ROC values at each time point of the ODR task. (c) Percentage of neurons in the adult age reaching different levels of ROC values at each time point of the ODR task. (d) Area under ROC curve in successive 250 ms windows is plotted as a function of time during the ODR+d task for the young (n=94) and adult stage (n=122). (e,f) As in b,c, for the ODR+d task.

