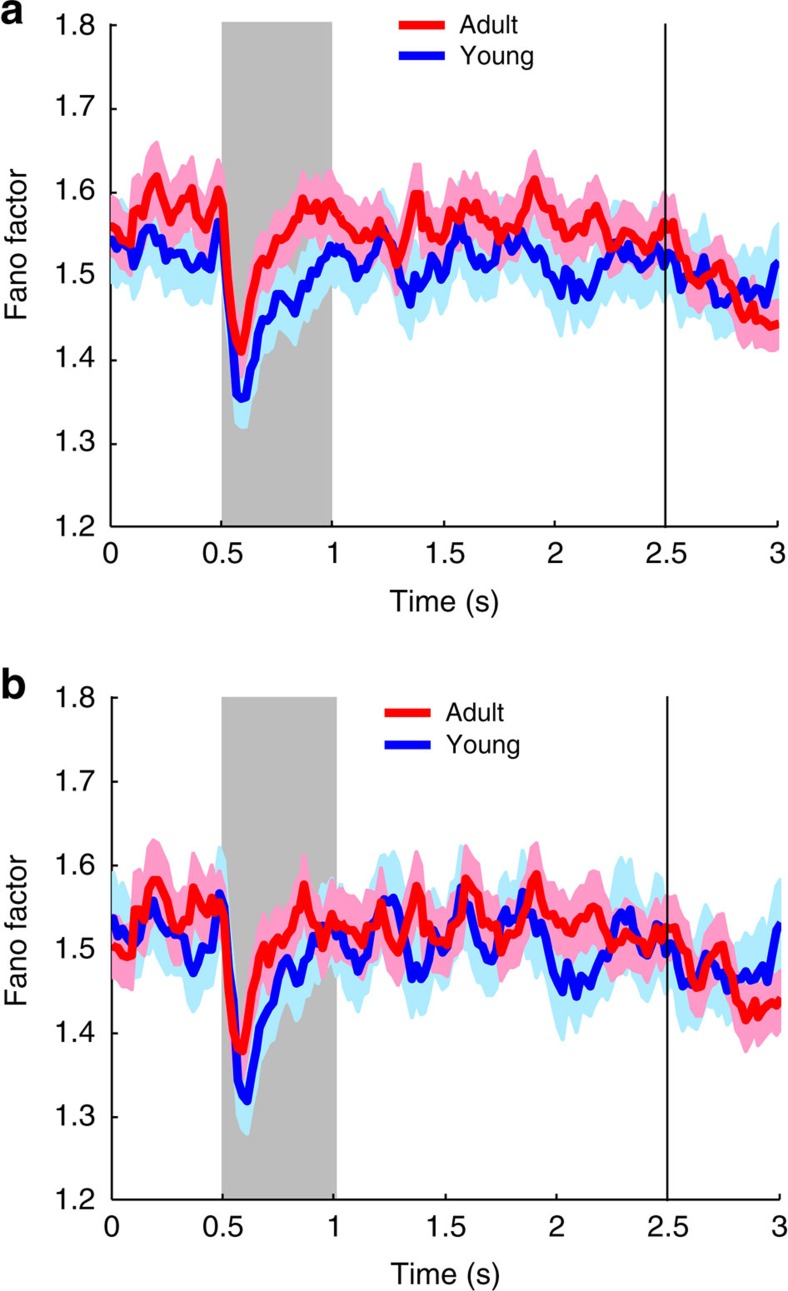
Figure 5. Variability of neuronal responses.
(a) Fano factor of spike counts is plotted as a function of time in successive time points (partially overlapping 100 ms windows), for the young (n=309 neurons) and adult (n=324) stage. (b) Fano factor is plotted as in a, but based on subsets of neurons matched for firing rate (n=231 for the young, 231 for the adult).

