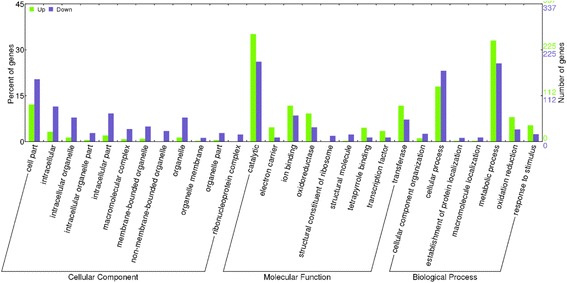
Fig. 2.

Classification of enriched GO terms of up- and down- regulated genes in sterile buds. The x-axis indicates the differentially expressed genes (DEGs) enriched sub-categories in three main categories: biological process, molecular function and cellular component by GO analysis, and the left y-axis indicates the percentage of DEGs of a sub-category in the main category and the right y-axis indicates the number of DEGs in a sub-category
