Fig. 1.

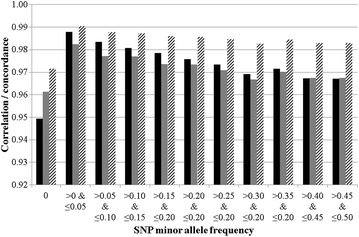
Mean correlation (black), genotype concordance rate (grey) and allele concordance rate (striped) between Illumina and Affymetrix genotypes by single nucleotide polymorphisms (SNP) minor allele frequency from the Illumina platform

Mean correlation (black), genotype concordance rate (grey) and allele concordance rate (striped) between Illumina and Affymetrix genotypes by single nucleotide polymorphisms (SNP) minor allele frequency from the Illumina platform