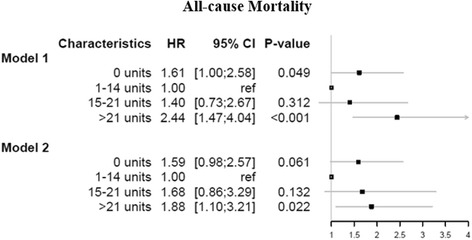
Fig. 3.

Hazard ratios and 95 % confidence intervals for all-cause mortality, as calculated by Cox regression models on the imputed data. Model 1: Adjusted for age and sex. Model 2: Adjusted for age, sex, smoking status, body mass index, educational level, household income, coronary artery bypass graft after 2008 (time), chronic obstructive pulmonary disease, acute myocardial infarction, atrial fibrillation, hypertension, liver disease, stroke, diabetes mellitus, heart failure and renal failure
