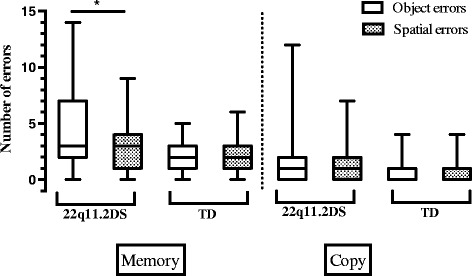
Fig. 2.

Boxplots with whiskers from minimum to maximum for object and spatial errors in the BVRT task of 22q11.2DS and TD groups (cross-sectional samples). The top of the box represents the 75th quartile, the bottom of the box represents the 25th quartile, and the band inside the box represents the median. * indicates significant values. Between-groups comparisons are not indicated on the graph, as all comparisons were statistically significant. Note: the medians for object and spatial copy errors for the TD group are equal to the 25th quartile
