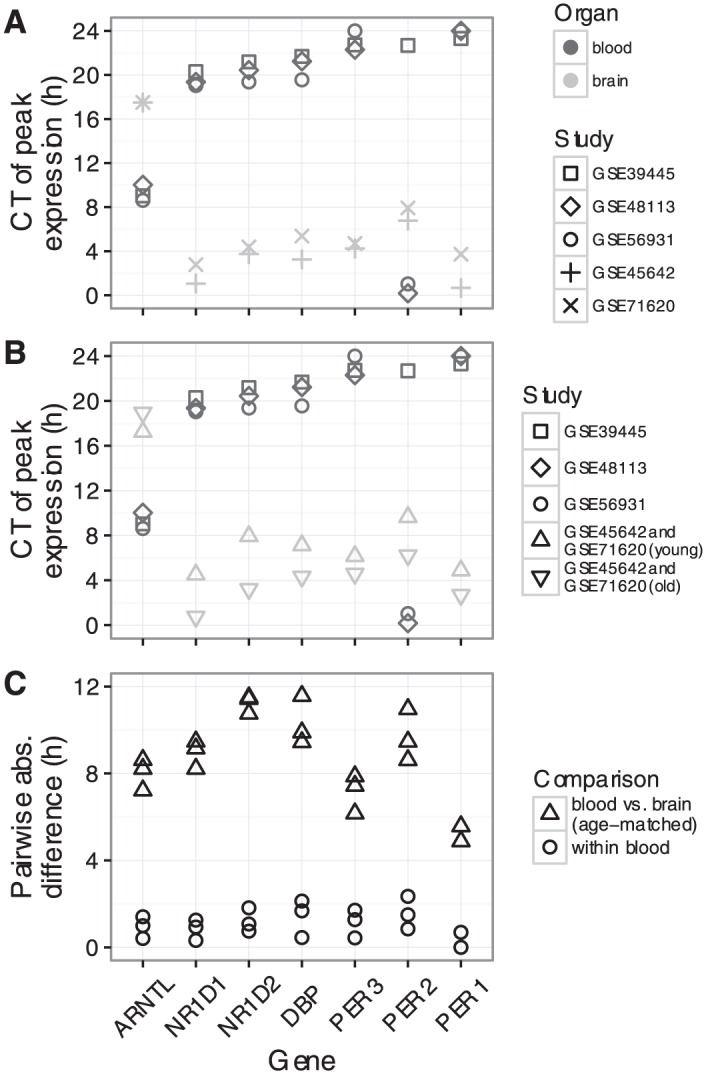
Figure 2.

Quantifying the phase difference between human blood and human brain. (A) Time of peak expression for each clock gene in each dataset. Symbols as in Figure 1. CT0 is equivalent to CT24. (B) Similar to A, except that samples from the two brain datasets have been merged, then split by subject age (≤40 or >40 years). (C) Pairwise absolute differences in peak time within and across organs. Each point corresponds to one pairwise comparison. Circles correspond to comparisons between the three blood datasets. Upward-pointing triangles correspond to comparisons between each blood dataset and the merged, young brain dataset (upward-pointing triangles in B).
