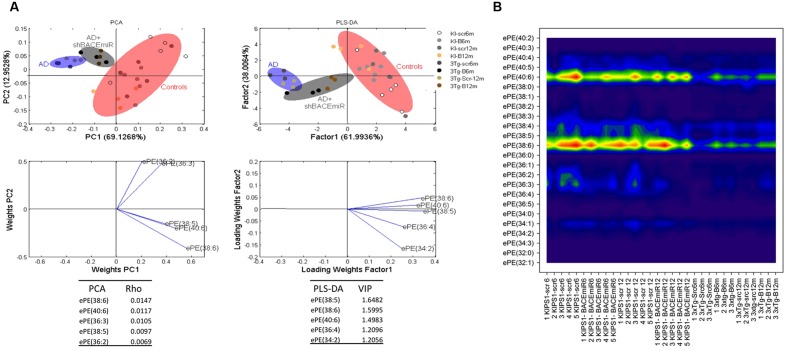
FIGURE 5.
shBACE1miR recovers the basal levels of ePE at 6 and 12 months post-injection. (A) PCA, principal component analyses for the ePE subclasses; PLS-DA, partial least squares method to discriminate between the ePE subclasses. The left panels illustrate the factor loadings for PC1 and PC2, with the indices of variance explained for each component. The right panels show the factor score plots for PLS-DA. The groups in the analyses are controls, AD (3xTg-AD without treatment) and AD+shBACE1-miR (3xTg-AD with 6 and 12 months of treatment). (B) Contour plots of the more influential subclasses of ePE (variables) in the discriminant analyses for each evaluated variable; all ePE subclasses were measured (means), and the error bars represent the SEM. n = 3–5 per group.

