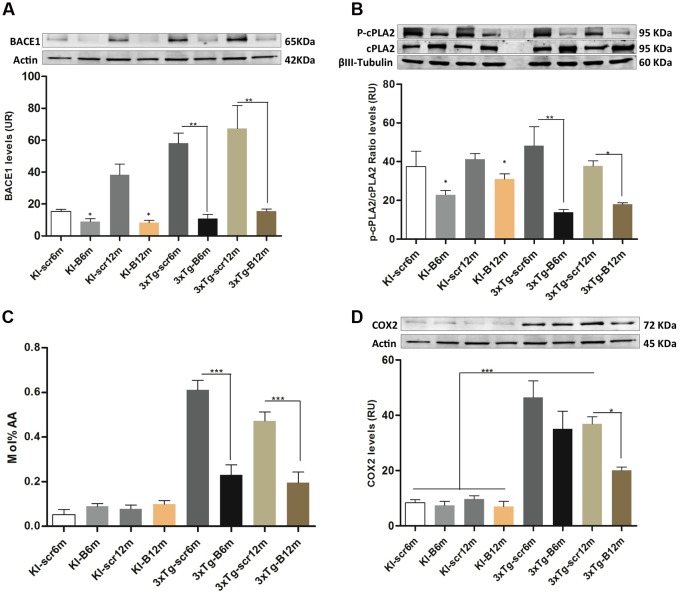
FIGURE 7.
shBACEmiR decreases the levels of phosphorylated cPLA2, ARA and COX2 levels in the hippocampus of old 3xTg-AD mice’s. (A) Representative bands from BACE1 protein levels and (B) p-cPLA2 levels at long and short-term shBACE1miR’s post-treatment (6 and 12 months) by Western blotting. (C) Arachidonic acid composition levels in LPE lipid. Results are expressed as Mol % of total fatty acids. (D) Representative immunoblot of COX2 protein levels. Results are expressed as relative units (RU) and. Data are shown as mean ± SEM. For 3xTg-AD, results were significantly different from the controls group (∗p < 0.05, ∗∗p < 0.01, ∗∗∗p < 0.001; ANOVA followed by Tukey post hoc test). n = 3–5 per group.

