
Figure 1.
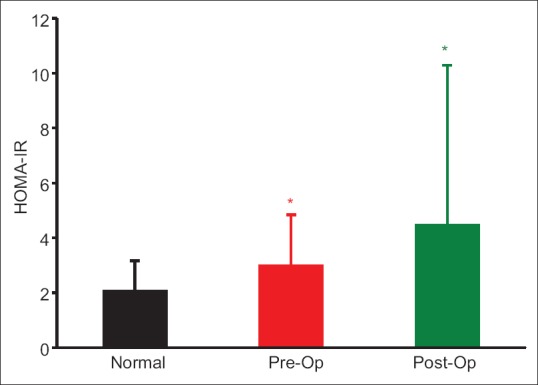
Comparison of homeostasis model assessment of insulin resistance of combined group (primary hyperparathyroidism) with the normal reference mean (2.06 ± 0.14), (FNx01P < 0.01). There was no significant difference between the pre- and post-operative homeostasis model assessment of insulin resistance (P = 0.292)