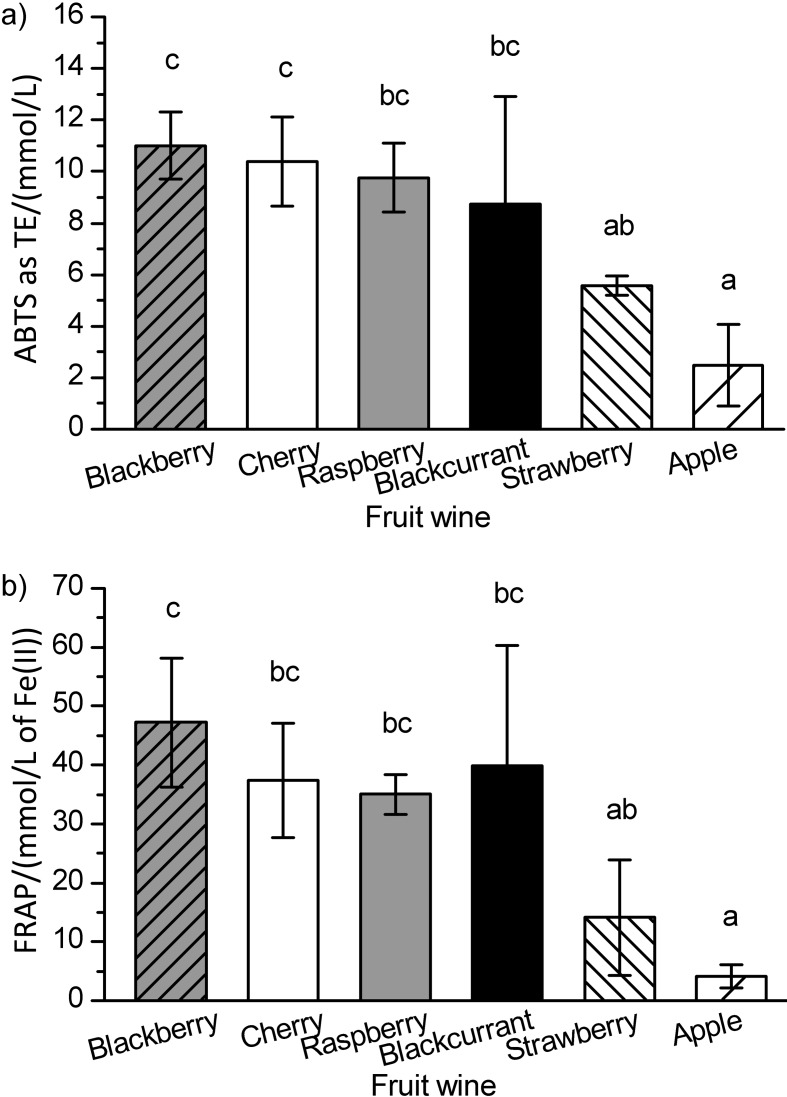
Fig. 1.
Antioxidant capacity of different commercial fruit wines determined by: a) ABTS and b) FRAP methods. Data are presented as mean value±standard deviation as error bar in number (N) of samples (see Materials and Methods) of each fruit wine. ANOVA was used to compare the data; different letters indicate significant differences between fruit wines (Tukey’s test, p<0.05)

