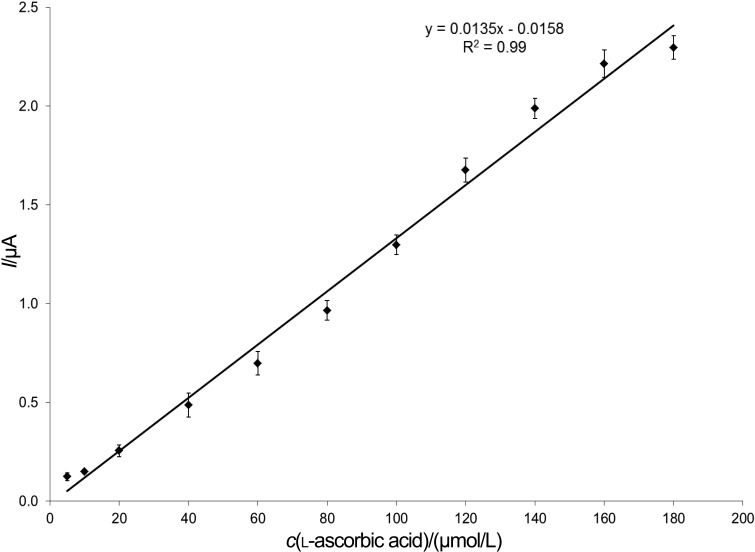
Fig. 4.
The calibration curve of the AAO-based biosensor, defined as the difference between the signals obtained using the BSA and the enzyme electrode (working conditions: 200 mmol/L of sodium acetate buffer with 100 mmol/L of KCl, pH=4.65, and 2 mmol/L of (HPO3)n; flow rate of 2.0 mL/min; polarization potential of 450 mV)

