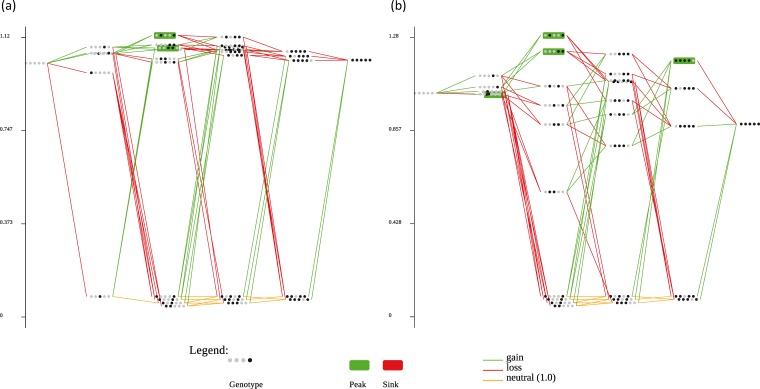
FIG 2.
Empirical fitness landscapes evaluated for the first five mutations fixed by TEV during its experimental adaptation to A. thaliana. The fitness of the 32 genotypes was evaluated in the novel host (a) and in the original one, N. tabacum (b). Each string of dots represents a genotype. Black dots represent a mutation in the corresponding locus, while white dots correspond to the wild-type allele at that locus. Genotypes in a green box correspond to local fitness peaks. Green lines correspond to beneficial mutations, red lines to deleterious mutations, and orange lines to neutral changes (in the direction from genotype ○○○○○ to genotype ●●●●●). Graphs were generated with the MAGELLAN Web server (33).

