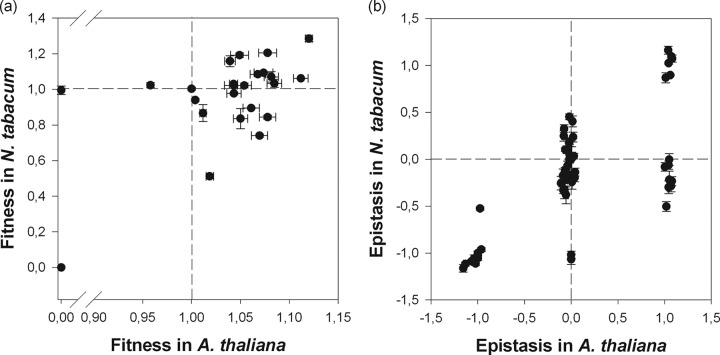
FIG 3.
Fitness values and epistasis coefficients for both hosts. (a) Fitness values estimated for the 32 genotypes shown in Fig. 2 for both hosts. For both hosts, fitness is expressed relative to that of the wild-type genotype (○○○○○). Dashed lines correspond to the fitness of the wild type in each host. The 0,0 dot includes the nine cases of unconditionally lethal genotypes. (b) Distribution of epistasis for both hosts. Dashed lines correspond to the case of multiplicative fitness effects (no epistasis). Error bars correspond to ±1 standard deviation (SD).

