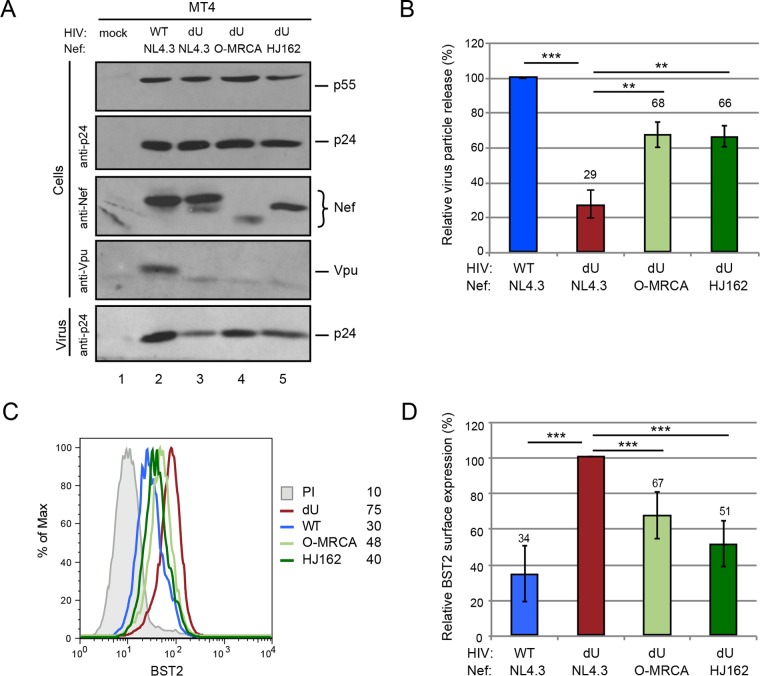
FIG 1.
Group O Nefs retain some BST2 antagonism. (A and B) MT4 T cells were mock infected or infected with GFP-expressing NL4.3 WT and dU viruses expressing either NL4.3 Nef or O-Nefs, as indicated. Infected cell populations with ∼30% GFP+ cells at 48 hpi were selected for comparison. (A) Cells and virion-containing supernatants were analyzed for the presence of Gag, Nef, and Vpu proteins by Western blotting. (B) The relative virus particle release efficiency was calculated as described in Materials and Methods and normalized to the value obtained for the WT virus, which was set at 100% (n = 3). (C) Flow cytometry analysis of surface BST2 in GFP-positive MT4 T cells infected with the indicated viruses. Mean fluorescence intensity values are indicated for each sample (staining using preimmune rabbit serum [PI]). (D) Relative BST2 surface expression levels after infection with the indicated HIVs (n = 4). The percent mean fluorescence intensity values were calculated relative to dU HIV-producing cells (100%). A two-tailed paired t test was used (***, P < 0.001; **, P < 0.01). Error bars represent standard deviations.

