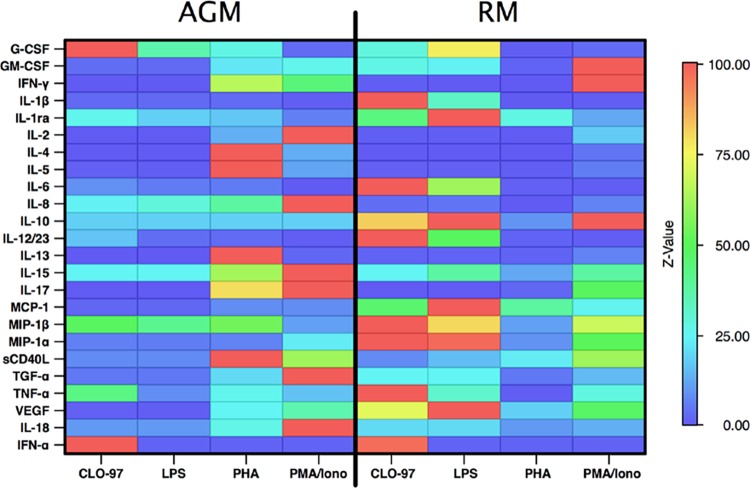
FIG 1.
Heat map illustrating normalized data from the validation study. PBMC from naïve RM (n = 11) and naïve AGM (n = 6) were cultured in RPMI medium alone or stimulated with CLO-97, LPS, PHA, or PMA-ionomycin. The median fold change for each analyte was calculated as the stimulated level divided by the unstimulated level and was normalized to the highest response across both species and stimulation conditions. In the spectrum of median fold change, red represents the maximum response, and blue represents the minimum response, across both types of NHP for each analyte.

