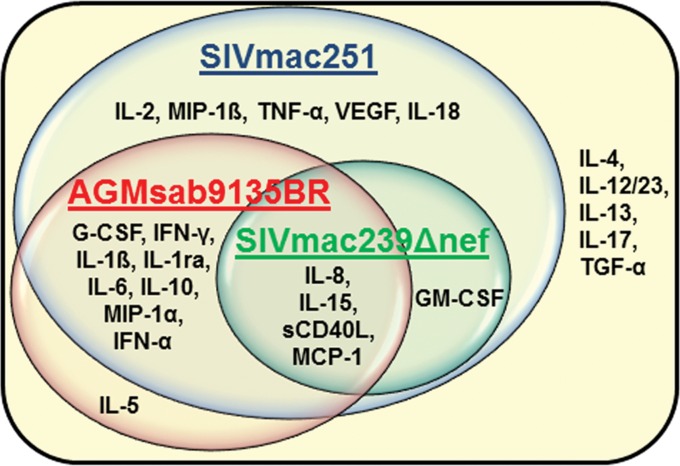
FIG 3.
Graphic representation of the analytes upregulated in the different SIV infection models. Positive cytokine and chemokine responses were defined in each animal as levels at a >95% confidence interval above the baseline mean for each species tested, twice the baseline value for each individual animal, and >5 pg/ml. If more than 50% of animals in a group exhibited a positive response for a given analyte, that analyte was determined to be upregulated for the group. The positive responses observed in each SIV model are indicated in the circles for AGM sab9135BR infection (red), RM SIVmac251 infection (blue), and RM SIVmac239Δnef infection (green). The common responses are represented in the intersection of the SIV model circles. The cytokines that were not found to be upregulated in any of the infection models are outside of all three circles.

