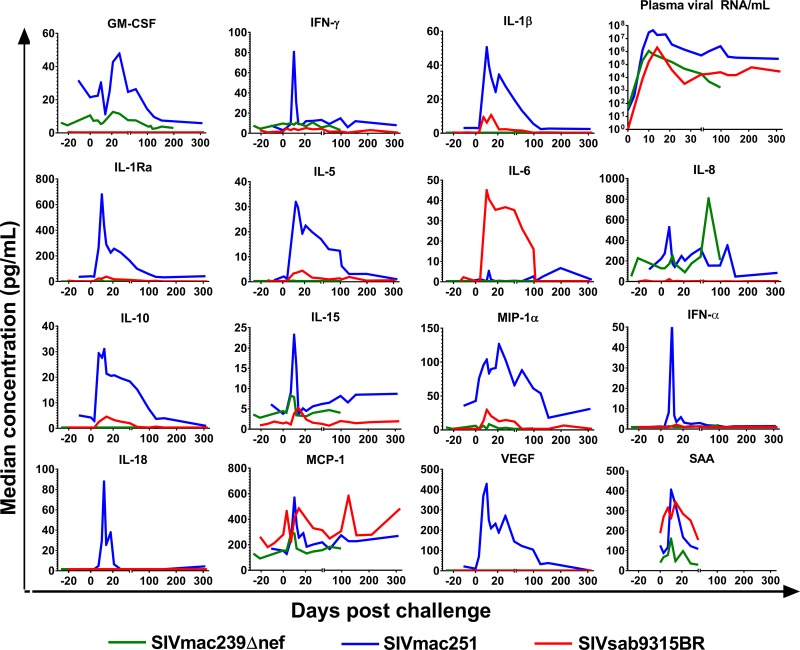
FIG 4.
Magnitude of analyte elevations over time after SIV infection. Median concentrations of 15 of the 25 analytes measured in plasma for the various groups are shown over time. Blue, RM infected with SIVmac251; green, RM infected with SIVmac239Δnef; red, AGM infected with SIVsab9315BR. Analytes whose concentrations did not rise above 5 pg/ml and twice the median baseline at any time point in any group are not shown. Serum amyloid A levels were measured during the first 5 weeks of infection in RM infected with SIVmac251 (n = 10), RM infected with SIVmac239Δnef (n = 9), and AGM infected with SIVsab9315BR (n = 6). One of the SIVmac239Δnef-infected RM was not included in the SAA evaluation due to insufficient sample volume.

