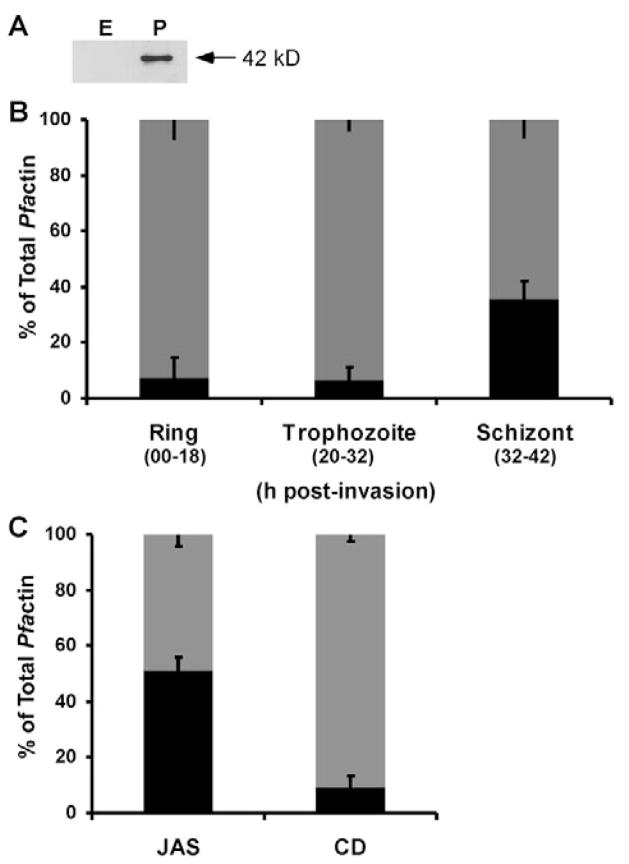
Fig. 4.
Parasite actin distribution in the erythrocytic cycle. (A) Western blot of 15 μg of erythrocyte (E) or parasite (P) protein showing the anti-actin antibody is specific for parasite actin and non-reactive with erythrocyte actin. (B) Pfactin in the triton-soluble (gray) and triton-insoluble (black) fractions was quantified by densitometric analysis of western blots using a parasite specific anti-actin antibody in ring (n=4), trophozoite (n=6) and schizont (n=5) stage PE. (C) Triton-soluble (gray) and triton-insoluble (black) Pfactin fractions were separated from trophozoites following JAS (n=6) or CD (n=6) treatment, and quantified by densitometric analysis of western blots using a parasite specific anti-actin antibody. Data are expressed as a percentage of total Pfactin±s.e.m.

