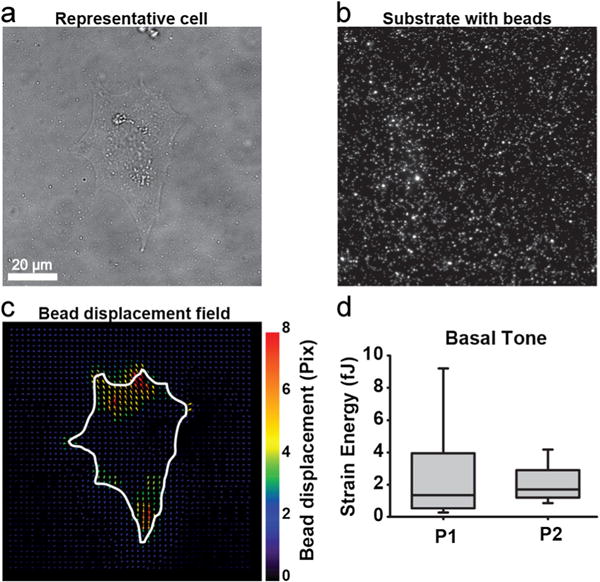
Fig. 4.

VSMC contractility at baseline using TFM. Representative cell traction force microscopy. White line, cell outline. a Bright-field image of cell. b Polyacrylamide substrate with 0.2 μm beads. c Bead displacements after cell is relaxed with HA-1077. d Basal tone measured by strain energy comparing P1 and P2 (n=24–25 in each cohort)
