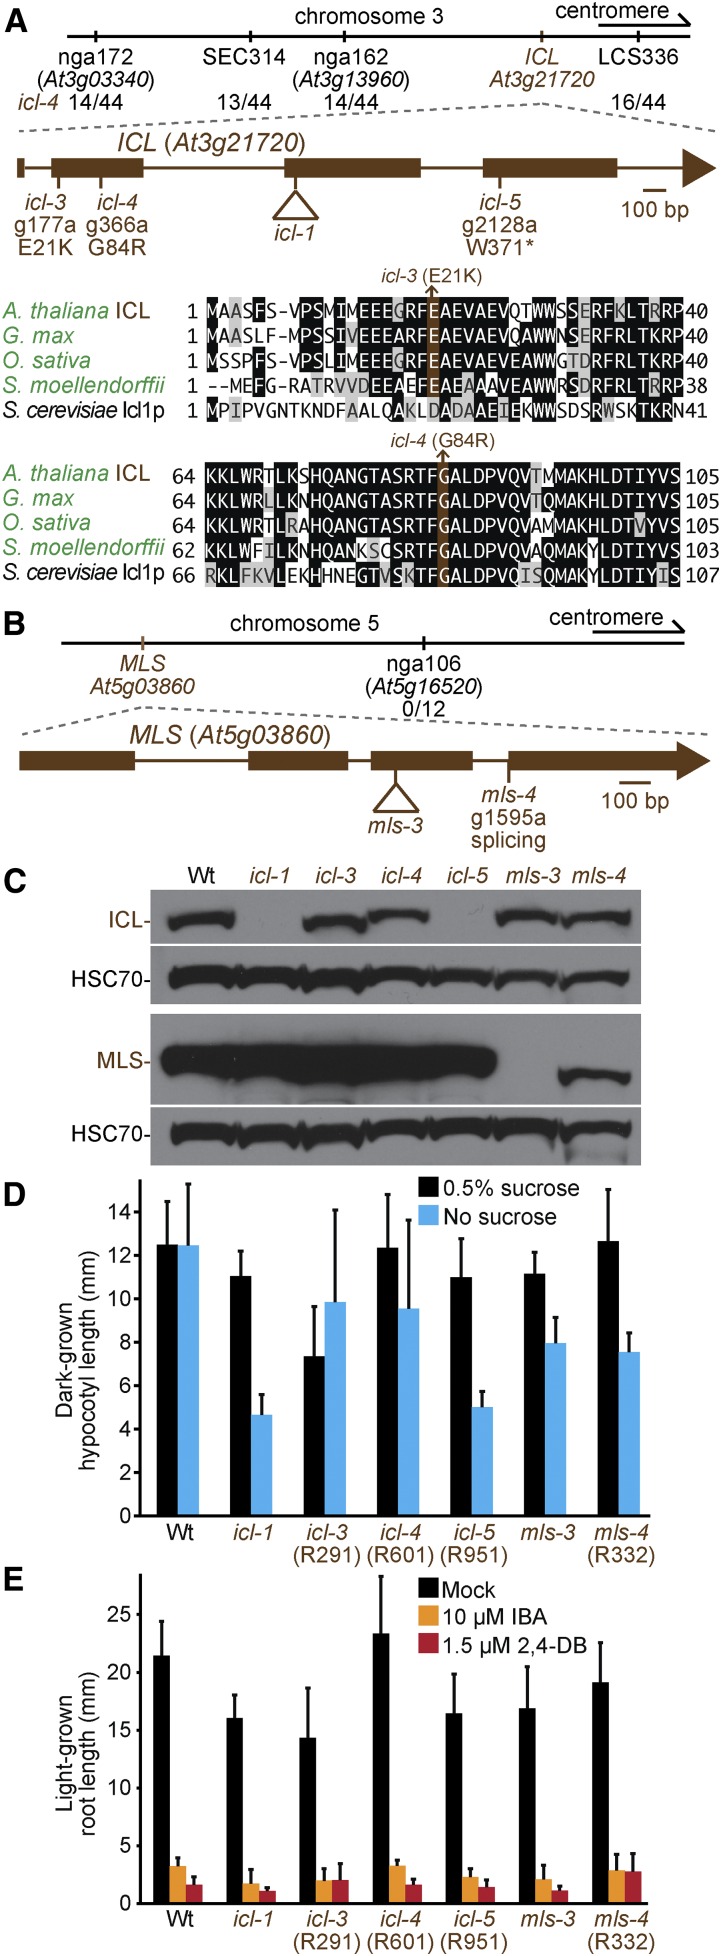
Figure 8.
Mutations in ICL and MLS confer sucrose dependence. (A, B) Chromosome maps indicate the positions of markers used to map icl-4 (A) or mls-4 (B) and ratios of recombinants to the number of chromosomes assessed. Gene diagrams indicate the positions of icl (A) or mls (B) mutations. ICL was aligned (A) with related proteins (Table S4); residues are shaded when identical (black or brown) or chemically similar (gray) in at least three sequences. (C) Eight-day-old seedlings were used for immunoblot analysis and serially probed with antibodies recognizing the indicated proteins. HSC70 was used as a loading control. (D) Hypocotyl lengths of 5-day-old dark-grown seedlings were measured. Error bars show SD (n = 20). (E) Root lengths of 8-day-old light-grown seedlings were measured. Error bars show SD (n = 20). Data are representative of two replicates (C, D).

