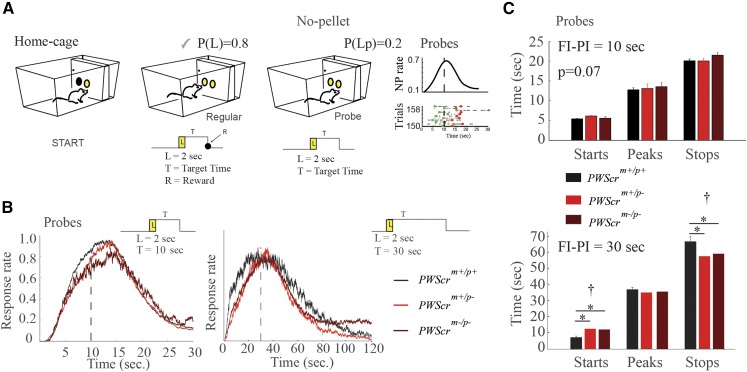
Figure 4.
Interval timing in PWScrm+/p+, PWScrm+/p−, and PWScrm−/p− mutants (A) Cartoon of the PI task. The mouse can initiate the trial with a nose poke (NP) in the central hopper (light on for 2 sec) and, to obtain a food pellet, it had to NP in the lateral hopper, after lights off, no sooner than 10 or 30 sec ( sec or sec), and no later than 30 or 60 sec, according to the experimental paradigm (see Materials and Methods). Regular and probe trials are shown. The right panel also shows a representative raster plot, and the distribution of start and stop times of NPs in probe trials. (B) Distribution of the response (NP) rate in probe trials ( sec on the left panel, and sec on the right panel). (C) STARTs and STOPs for the PWScrm+/p+ (n = 6), PWScrm+/p− (n = 6), and PWScrm−/p− (n = 5) are shown for the two 10-sec and 30-sec FI–PI schedules. Graphs are presented as the mean SEM. The cross notation mark above the asterisks in the bars represent the one-way ANOVA between groups, while the asterisks represent post hoc significance () corrected by Holm’s correction.

