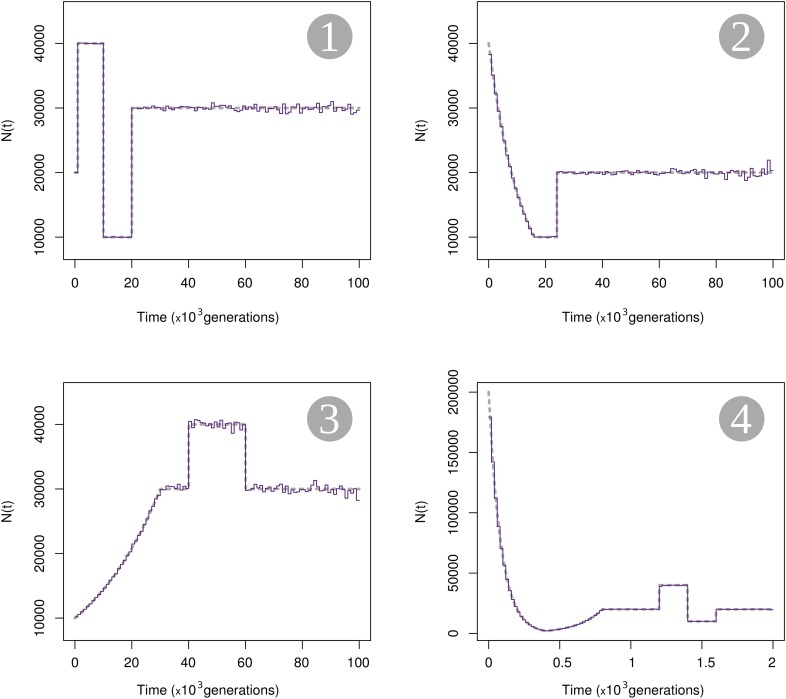
Figure 2.
Estimation of N based on simulated gene genealogies. Four scenarios of variable population sizes are used to generate 1,000,000 independent loci in each scenario, for a sample of size 20 (10 diploid individuals). Time is divided into 100 regular intervals and estimates of the harmonic mean of N (purple solid lines) for all intervals are plotted. The true values of N over time are indicated by gray dashed lines. Figure S4 further explore the uncertainty of the estimate of N based on finite loci.

