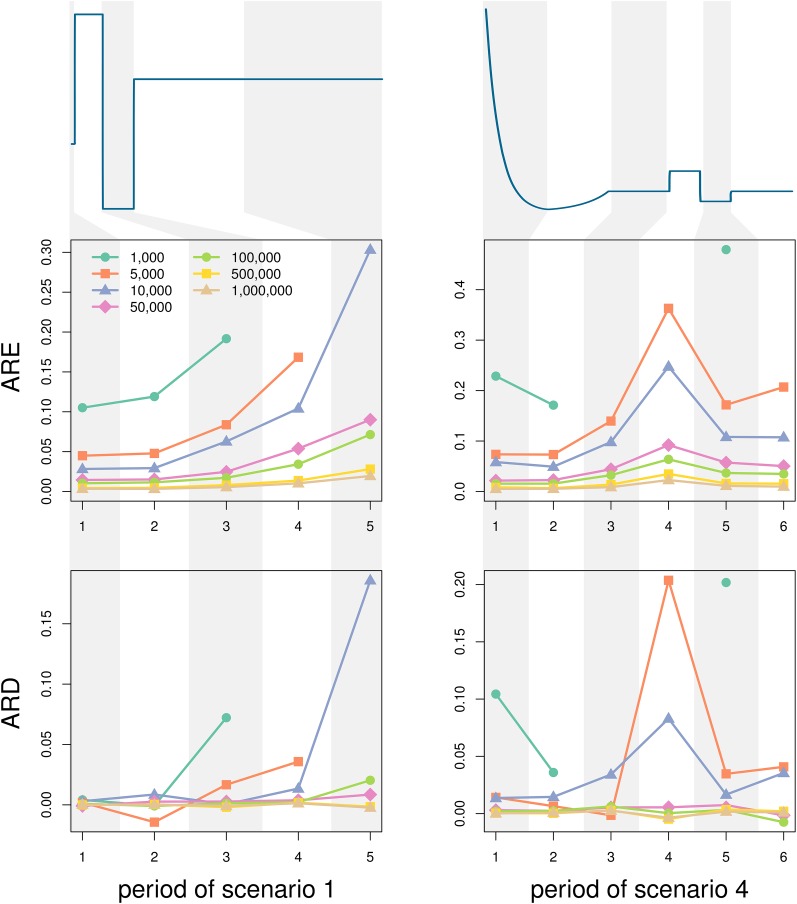
Figure 4.
Effect of the number of loci. We divide scenario 1 (left panel) and scenario 4 (right panel) into smaller periods of time where we assess the average relative error (ARE) and the average relative difference (ARD) on the N estimates compared to the true values of N, as functions of the number of loci used for the estimation. The sample size for all simulations is 20. The original scaling for the x- and y-axes of both scenarios can be found in Figure 2.

