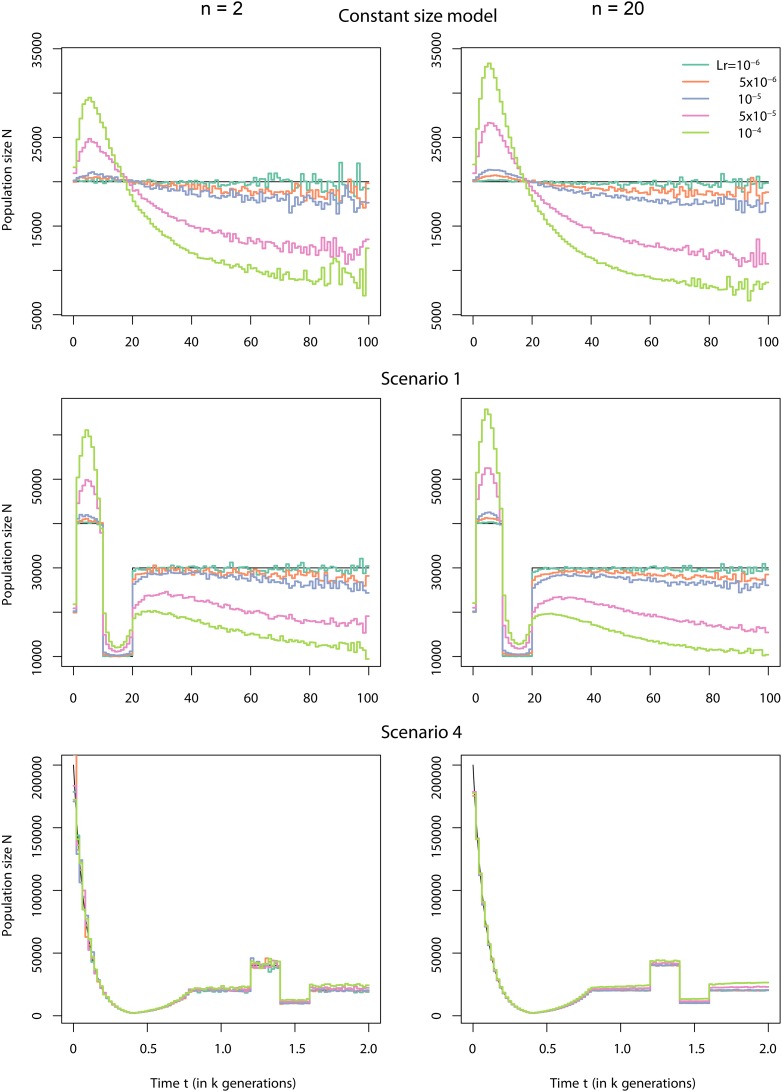
Figure 5.
Effect of omitting recombination. Shown is a comparison between reconstructed using gene genealogies computed as a weighted average of the gene genealogies obtained from ms and true (black lines) under three different demographic scenarios. We generated 1,000,000 independent loci for two different sample sizes, 2 and 20 haploid gene copies, and for five different levels of recombination within each locus. The three different demographic scenarios were the constant-size model (top), scenario 1 (middle), and scenario 4 (bottom). The different cryptic recombination rates for each locus (in morgans) are indicated by different colors and the values of the recombination of the segments are given in the key.

