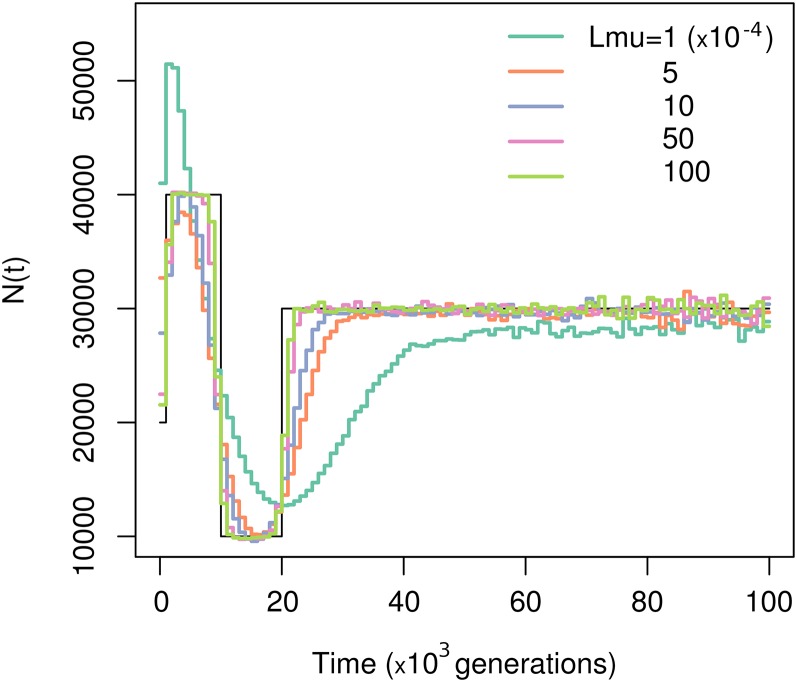
Figure 6.
Effect of estimating gene genealogies from polymorphism data. Shown is reconstruction of from distributions of coalescent times computed from gene genealogies inferred from polymorphism data. We used a sample size of 20 and 1,000,000 independent loci, evolving under scenario 1. The mutation rate per locus is indicated by the color of the line and the key gives the mutation rates.

