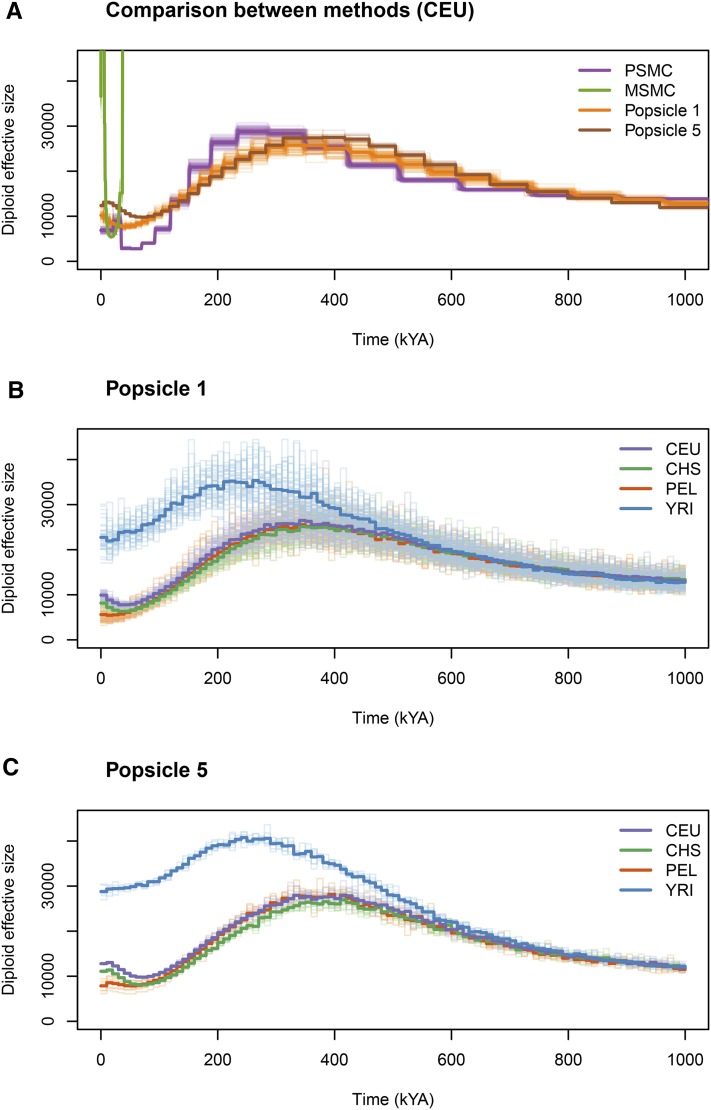
Figure 7.
Comparison of inference among different methods. (A) Comparison of profiles inferred using PSMC, MSMC, Popsicle 1, and Popsicle 5. (B) Inferred profiles for four populations, CEU, CHS, PEL, and YRI based on Popsicle 1. (C) Inferred profiles for four populations, CEU, CHS, PEL, and YRI based on Popsicle 5. The timescale is computed assuming a mutation rate of and a generation time of 25 years.

