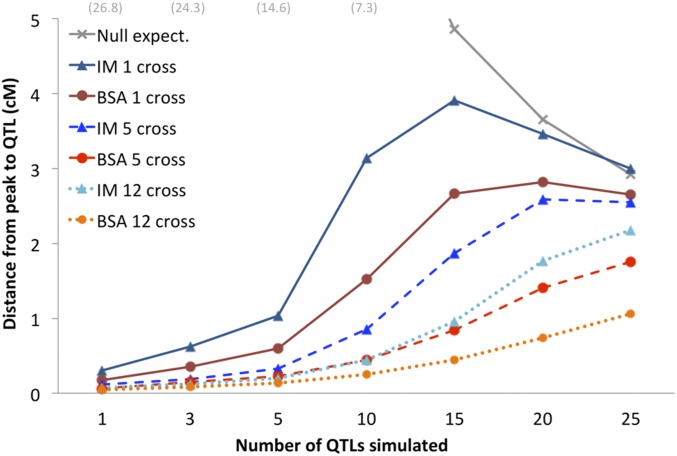
Figure 4.
Results are shown for exploratory BSA and IM simulations with varying numbers of QTL and numbers of jointly analyzed independent crosses. As a proxy for method performance, the median centimorgan distance between the true QTL and the statistic maximum (of ad for BSA or ap for IM) is shown. The null expectation for a randomly located peak within a QTL’s analysis window is also shown (gray). These results indicate: (1) the increasing challenge of more polygenic scenarios for all approaches, (2) a general advantage of BSA over IM, and (3) the utility of combining data from independent crosses that all share a given QTL in common.

