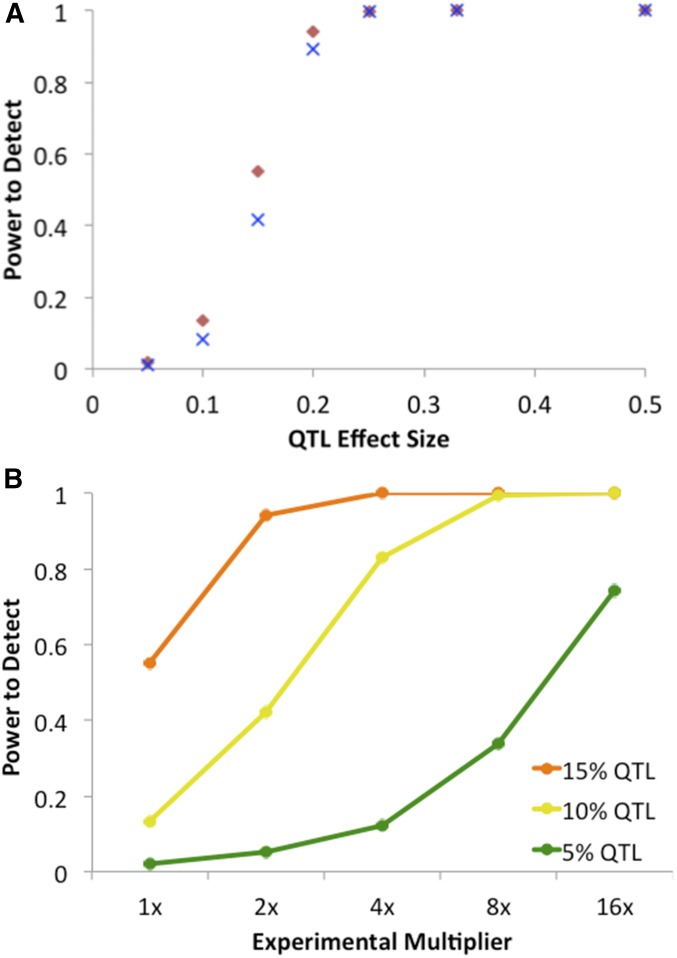
Figure 7.
(A) Results of one locus test simulations assessing the power of the SIBSAM pipeline to detect a QTL on the autosomes (red diamond) or the X chromosome (blue X). The scenario investigated here involves a population of 1200 individuals with 600 phenotyped after 16 generations and 10% retained in each phenotypic pool, and with a depth of 1000 informative sequencing reads per window. This scenario showed intermediate power for a QTL explaining 15% of phenotypic variance in the experimental population, with low/high power below/above that mark. (B) The ability of a larger experiment to boost detection power for weaker QTL was investigated. The mapping population size, number of individuals phenotyped, and sequencing depth was multiplied (compared to the numbers given above) as shown on the x-axis. In a sufficiently large experiment, the power to detect QTL explaining 10% or even 5% of phenotypic variance was considerably increased.

