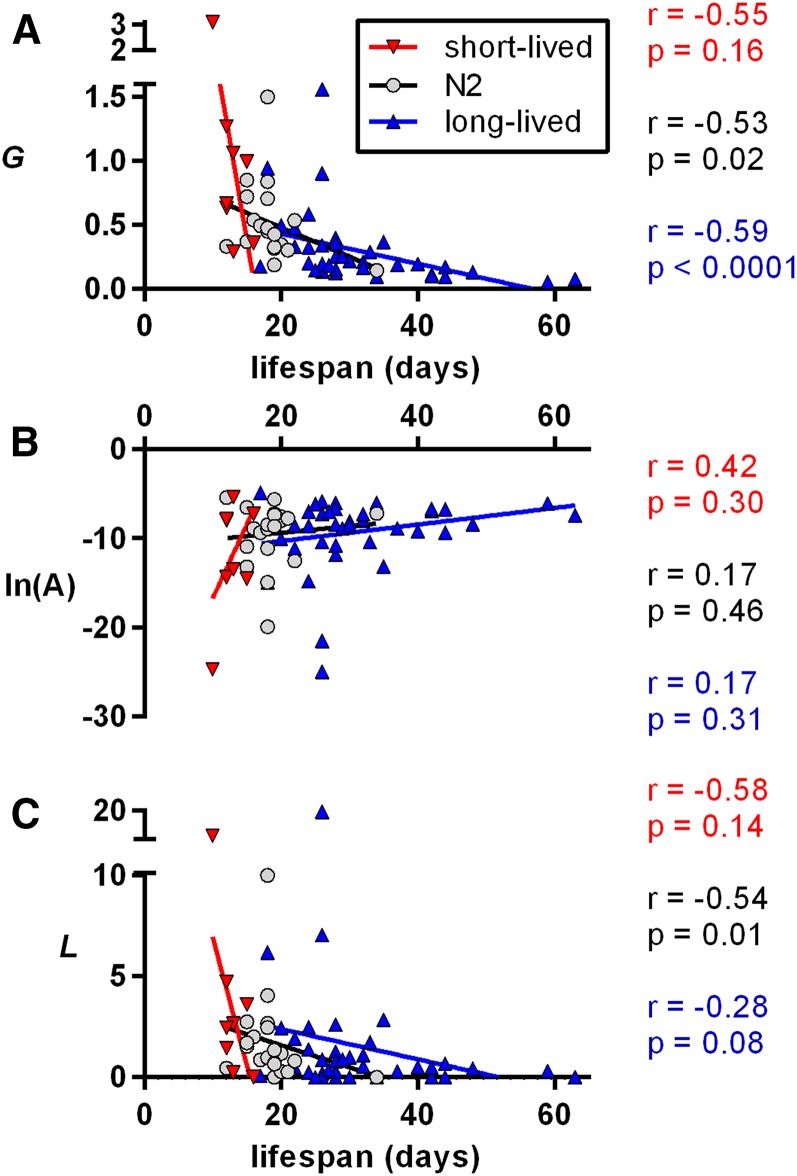
Figure 5.
Logistic parameter values for short-lived, long-lived, and wild-type control (N2) lines of C. elegans. Lines of best fit, Spearman correlation coefficients, r, and associated P-values are shown. (A) MLE estimations of the Gompertz parameter G, describing the age-related acceleration of mortality rates. (B) Natural logarithms of the MLE estimations of the Gompertz parameter A, the baseline mortality rate. (C) MLE estimations for the late-stage mortality rate deacceleration parameter L. Note that the line of best fit (determined by linear regression) is shown as an aid for the reader, and the P-values shown were determined separately by nonparametric methods.

