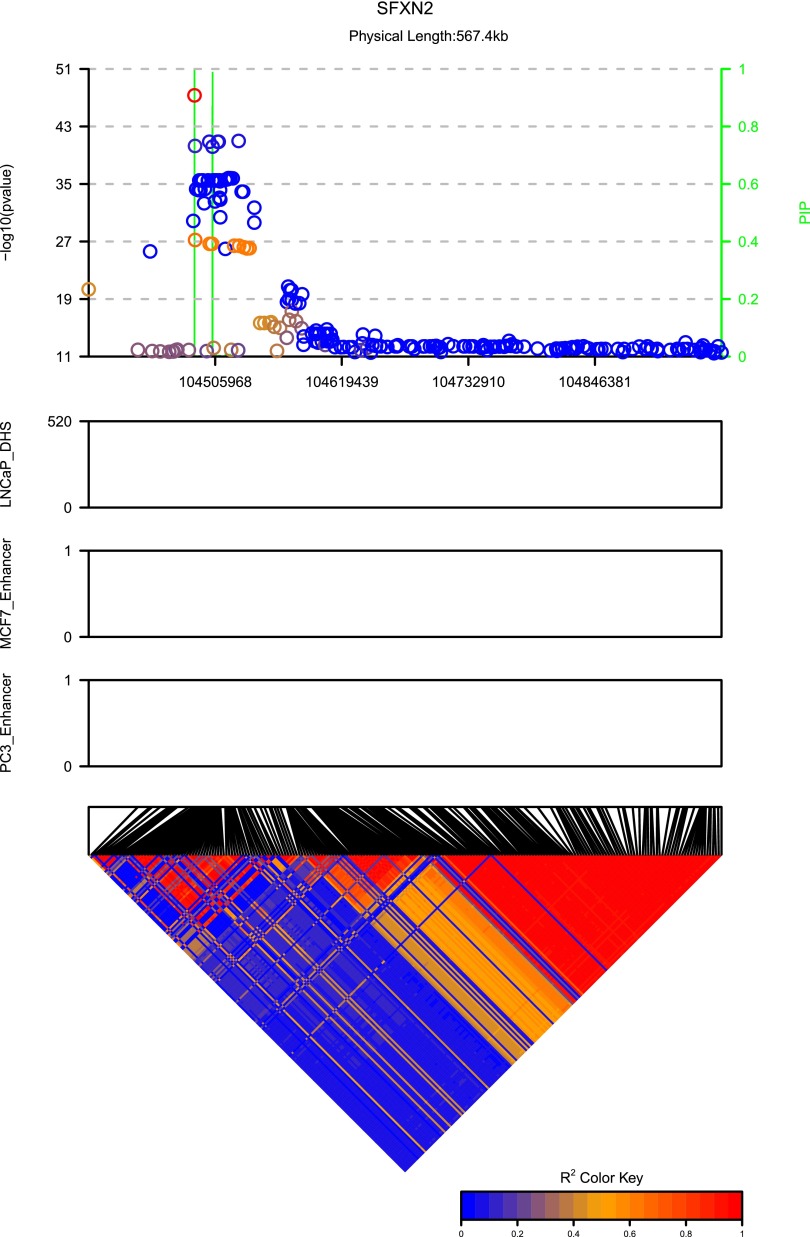
Figure 10.
P-values, PIPs, annotations, and the LD for cis-eQTL analysis of SFXN2. The green lines are PIPs. The LD between the peak SNP and the remaining SNPs are color coded in the top panel. The three middle panels illustrated the annotations for individual SNPs. The bottom diagonal matrix shows the LD pattern among all SNPs in this locus.

