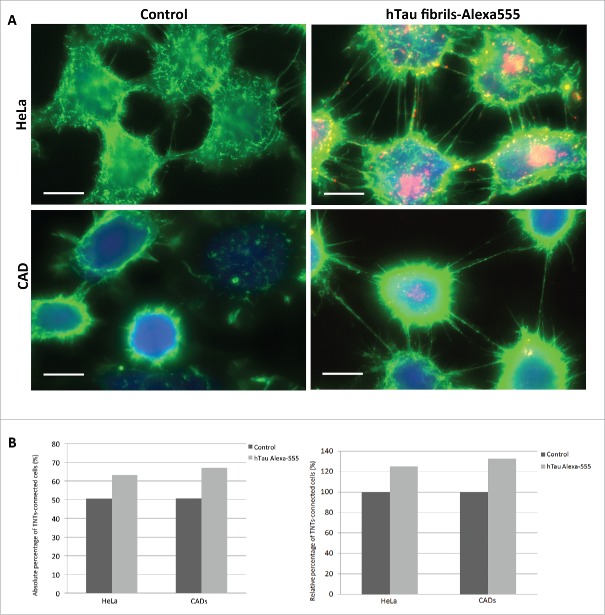
FIGURE 2.
TNT number is increased in cells containing tau fibrils. A: Representative pictures of HeLa (top) and CAD (bottom) cells labeled with WGA-Alexa 488 (green) in control untreated conditions (left) or incubated with Alexa-555 tau fibrils (red) for 16 h (right). Scale bar: 15 and 10 µm for HeLa and CAD respectively. B: Quantification of TNT connected cells from experiment done in A. Absolute and relative data are shown in left and right respectively.

