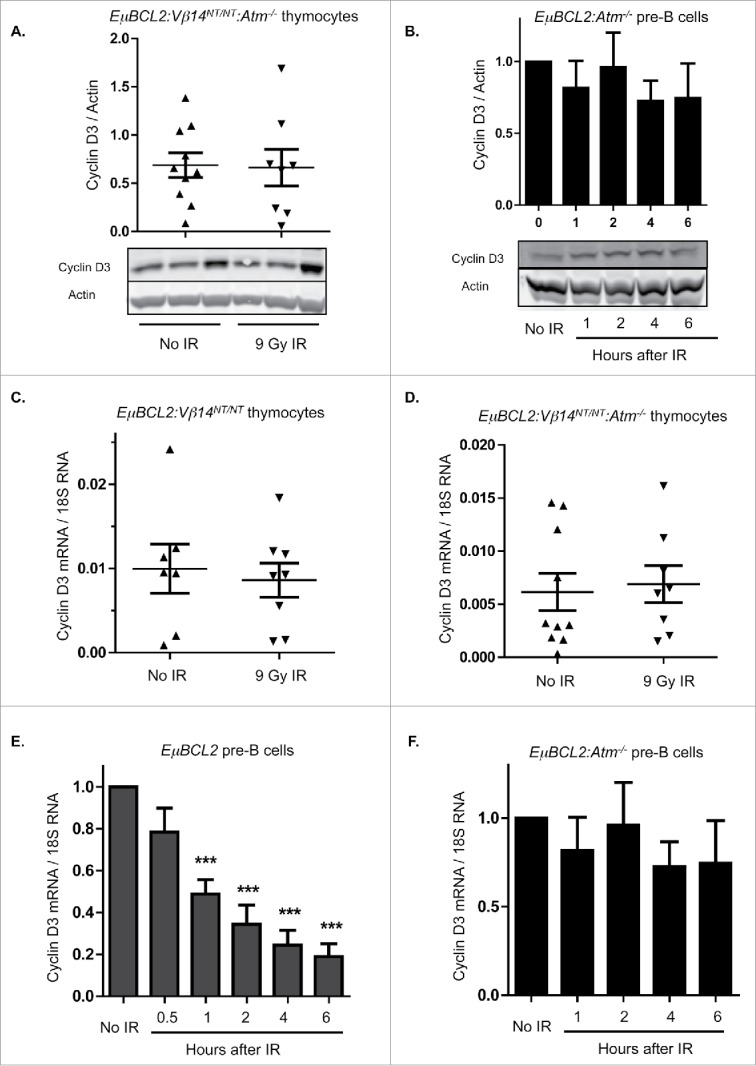
Figure 2.

DSBs suppress Cyclin D3 expression via ATM-dependent lymphocyte lineage-specific mechanisms. (A) Representative Western blot analyses of Cyclin D3 and actin protein and graphical quantification of Cyclin D3 protein expression in thymocytes of unirradiated or irradiated EμBCL2:Vβ14NT/NT:Atm−/− mice at 4 hours following exposure of mice to 9 Gy of IR. Each lane contains thymocyte protein from a single mouse. This experiment was conducted 4 times with a total of 10 unirradiated and 8 irradiated mice. Error bars are standard error. (B) Representative Western blot analyses of Cyclin D3 and actin protein and graphical quantification of Cyclin D3 protein expression in unirradiated or irradiated IL7-cultured EμBCL2:Atm−/− pre-B cells at indicated times after exposure to 9 Gy of IR. This experiment was conducted 4 times with more than one unirradiated mouse and more than one irradiated mouse each time. Error bars are standard error. ((C)- D) Graphical quantification of Cyclin D3 mRNA levels relative to 18S RNA levels in thymocytes from unirradiated or irradiated EμBCL2:Vβ14NT/NT mice (C) or EμBCL2:Vβ14NT/NT:Atm−/− (D) mice at 4 hours after exposure to 9 Gy IR. Each data point is from a single mouse. Each of these experiments was conducted 4 times with a total of 10 unirradiated and 8 irradiated mice. Error bars are standard error. (E- F) Graphical quantification of Cyclin D3 mRNA levels relative to 18S RNA levels in unirradiated or irradiated IL7-cultured EμBCL2 (E) or EμBCL2:Atm−/− (F) pre-B cells at indicated times after exposure to 10 Gy of IR. Cyclin D3 expression levels are set to 1.0 for the unirradiated control in each experiment and other time points are normalized to this control. These experiments were performed 4 times. Error bars are standard error. ***p < 0.001 in comparison to the unirradiated control.
