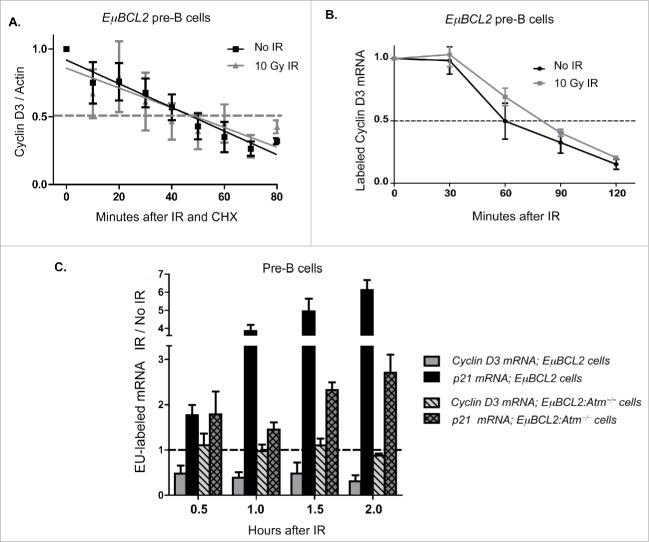
Figure 4.
DSBs induced in pre-B Cells suppress Cyclin D3 protein levels through ATM-dependent inhibition of Ccnd3 transcription. (A) Western blot quantification of Cyclin D3 protein levels relative to actin protein levels in unirradiated or irradiated IL7-cultured EμBCL2 pre-B cells at indicated times after addition of cycloheximide and/or exposure to 10 Gy of IR. This experiment was performed 6 times. Values are normalized to 1.0 for unirradiated cells immediately after cycloheximide addition within each experiment. (B) qRT-PCR quantification of EU-labeled Cyclin D3 mRNA levels relative to EU-labeled 18S RNA levels in unirradiated or irradiated IL7-cultured EμBCL2 pre-B cells at indicated times after EU washout and/or exposure to 10 Gy of IR. Values are normalized to 1.0 for cells immediately before IR within each experiment. This experiment was performed 4 times. (C) qRT-PCR quantification of EU-labeled Cyclin D3 and p21 mRNA levels relative to total/EU-labeled Hprt levels in unirradiated and irradiated IL7-cultured EμBCL2 and EμBCL2:Atm−/− pre-B cells at indicated times after addition of EU and exposure to 10 Gy of IR. Data are presented as the ratio of relative levels of each mRNA in irradiated cells compared to unirradiated cells. The dotted line represents a value of 1, which would indicate that IR had no effect on the transcription rate of an assayed gene(s). This experiment was performed 3 times. Error bars are standard error. Statistical analysis using the 2-way ANOVA method indicates all differences are significant (p < 0.001).

