
Figure 4.
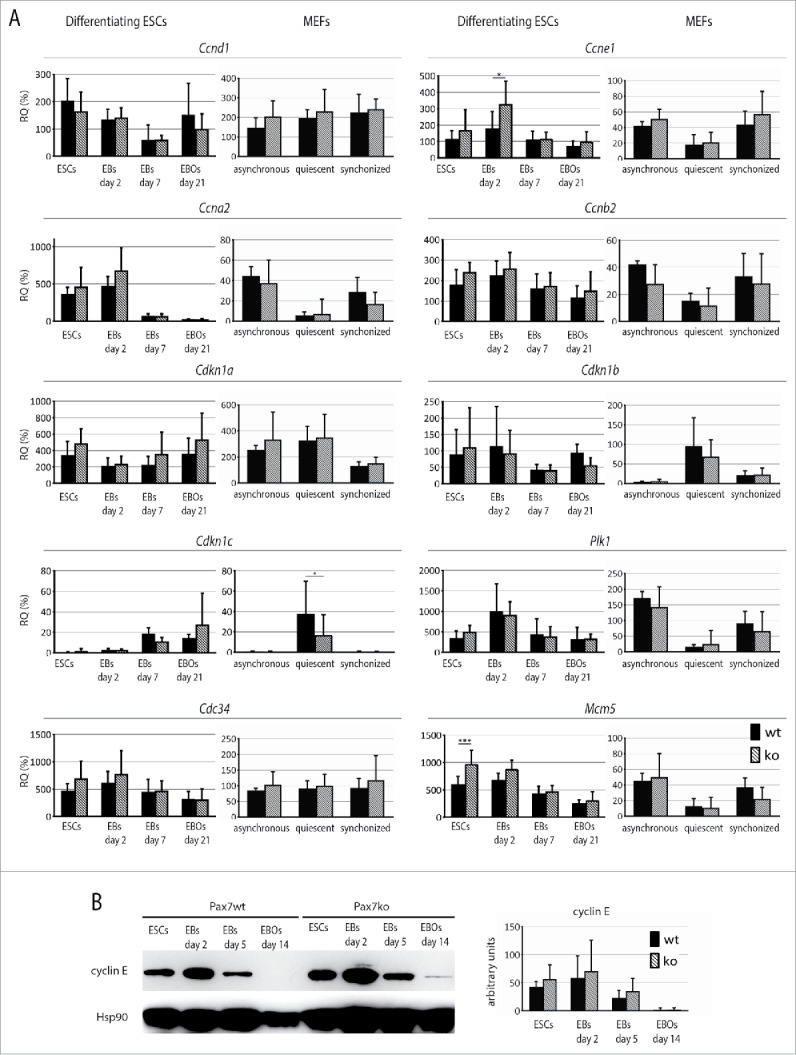
Analysis of factors involved in regulation of cell cycle in both Pax7ko and Pax7wt ESCs and MEFs. (A). RT-qPCR analysis of Ccnd1, Ccne1, Ccna2, Ccnb2, Cdkn1a, Cdkn1b, Cdkn1c, Plk1, Cdc34, and Mcm5 transcript levels in undifferentiated ESCs, EBs at day 2, 7 and EB outgrowths at day 21 of differentiation, as well as asynchronously dividing, quiescent and synchronously cycling MEFs. Data are shown as CT values, which were normalized against those of Actb mRNA level. Data are represented as the percentage of expression observed in mouse embryos at day 13.5 of development. For each genotype 2 ESC and 3 MEF lines were analyzed, graphs represent the mean values. P-values: *<0.05, ** <0.01, *** <0.001. (B). Western blotting analysis of cyclin E1 levels in ESCs, EBs at day 2 and 5, and EB outgrowths at day 14 of differentiation. Probing with anti-Hsp90 antibody was used as a loading control. Graph represents optical density of cyclin E bands compared to density of Hsp90 bands (optical density of Hsp90 was taken as 100 arbitrary units).