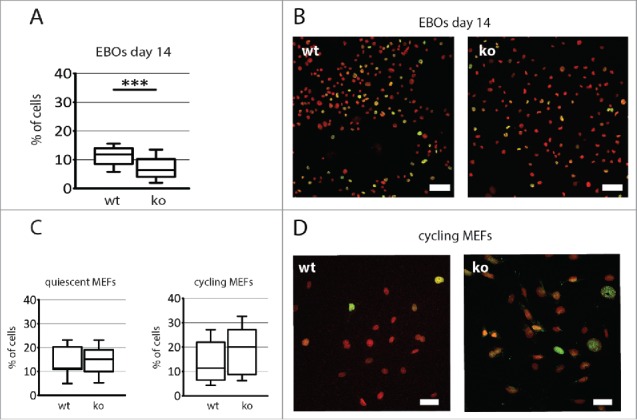
Figure 7.

Analysis of apoptosis rate of both Pax7ko and Pax7wt ESCs and MEFs. (A). The proportion of cells expressing γ-H2A.X in EB outgrowths at 14 day of differentiation. P-value: ***<0.001. (B). Localization of γ-H2A.X (green) and nuclei (red) in EB outgrowths at 14 day of in vitro culture; bar 50 µm. (C). The proportion of cells expressing γ-H2A.X in quiescent (left diagram) and cycling (right diagram) MEFs. (D). Localization of γ-H2A.X (green) and nuclei (red) in cycling MEFs; bar 50 µm. For each cell type and genotype 3 cell lines were analyzed, graphs represent the median values.
