Figure 3.
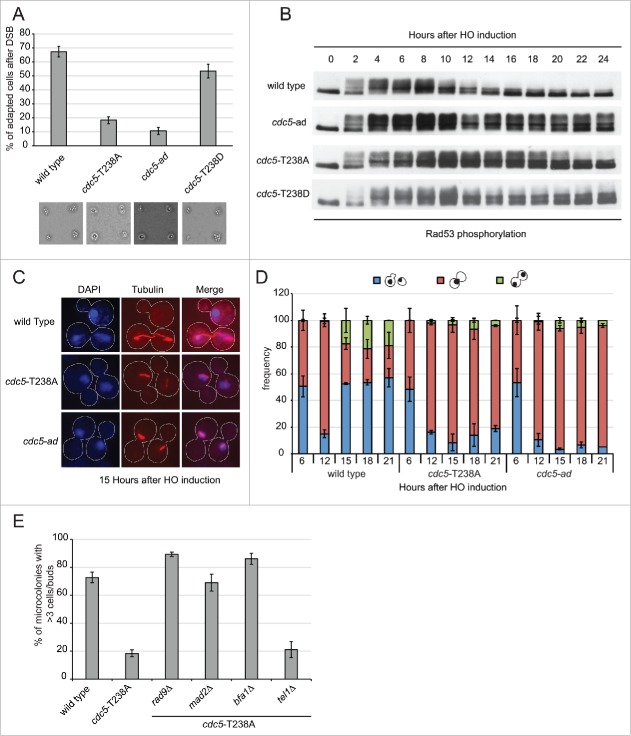
cdc5-T238A cells are defective in checkpoint adaptation to persistent DNA damage. (A) Graph shows the percentage of microcolonies with 3 or more cells plus buds for each mutant 24 hours after plating on galactose containing medium to induce one irreparable HO cut. Values are the mean of 3 independent experiments ± standard deviation. Representative images of cells/microcolonies for each strains 24 hours after plating are shown. The strains used are: Y152 (CDC5::3xHA), Y1466 (cdc5-T238A::3xHA), Y1465 (cdc5-ad::3xHA), and Y1573 (cdc5-T238D::3xHA). (B) Rad53 phosphorylation analysis by western blot of same strains as in (A) after one persistent HO-cut. (C-D) Analysis of nuclear division (DAPI) and spindle elongation (visualized with anti-α tubulin) after one persistent HO-cut analyzed in strains Y152 (CDC5::3xHA), Y1466 (cdc5-T238A::3xHA) and Y1465 (cdc5-ad::3xHA). (C) Representative images of cells after the indicated time after one irreparable HO-cut induction. The graph in (D) shows frequency of the indicated subpopulations at given time point as mean of 3 independent experiments ± standard deviation. Values were obtained counting at least 100 cells at each time point for each strain. (E) Graph shows the percentage of microcolonies with 3 or more cells plus buds for each strain 24 hours after plating on galactose containing medium to induce one irreparable HO cut. The strains used are: Y152 (CDC5::3xHA), Y1466 (cdc5-T238A::3xHA), Y1535 (cdc5-T238A::3xHA, rad9Δ), Y1574 (cdc5-T238A::3xHA, mad2Δ), Y3535 (cdc5-T238A::3xHA, bfa1Δ) and Y2155 (cdc5-T238A::3xHA, tel1Δ). Values are the mean of 3 independent experiments ± standard deviation.

