Figure 3.
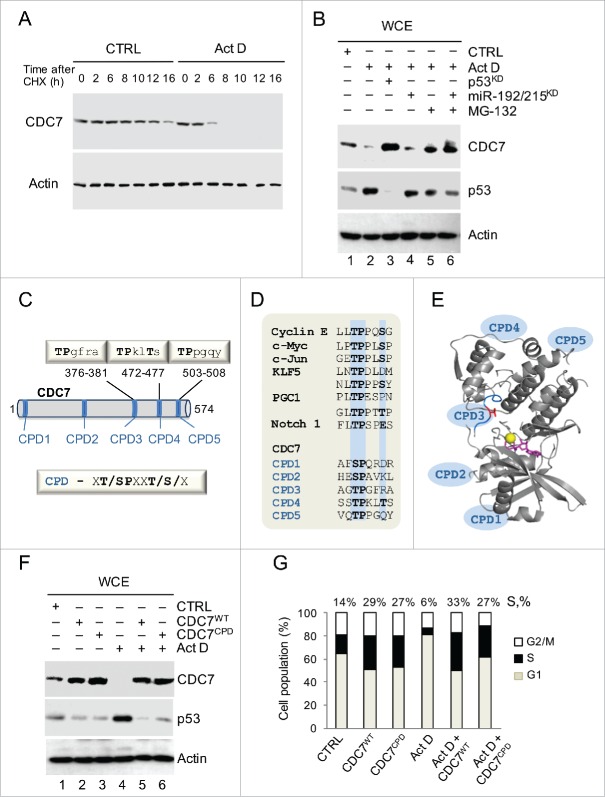
Stress-induced Proteolysis of CDC7 is Dependent on CDC4-type Phospho-degrons (CPDs). (A) IMR90 cells were treated with cycloheximide (CHX, 10 μg/ml) in the presence of either DMSO (CTRL) or Actinomycin D (ActD; 1nM). Cells were harvested at the indicated time points and whole cell extracts (WCE) were analyzed by immunoblotting with an antibody against CDC7. (B) Immunoblotting analysis of WCE prepared from IMR90 cells that were first treated with either p53 siRNAs (48h) or miR-192/215 siRNA (24h) and then treated with ActD in the presence or absence of MG-132 (10 μM). (C) The putative Fbxw7 recognition motifs (CPDs) in the CDC7 protein sequence. The CDC4-phospho degron (CPD) consensus sequence is xT/SPxxT/S/x, where x is any amino acid residue. (D) Alignment of the phosphodegron motifs (CPDs) present in known Fbxw7 substrates with 5 CPDs in the CDC7 primary protein sequence. Positions of the key amino acid residues are highlighted in blue. (E) CDC7 structure (PDB 4f9a) shown as a ribbon with indicated positions of CPDs. Positions of CPDs 1, 2, 4 and 5 were predicted by modeling using iTasser and Phyre2 (see Methods and Fig. S4); Thr 376 in CPD3 is shown in red, ATP is shown in magenta and the Mg atom is shown as a yellow sphere. (F) CDC7 mutated on CPDs (CPDs 3, 4 and 5, CDC7CPD) and ectopically-expressed for 48h in IMR90 cells demonstrated more pronounced resistance to degradation compared to CDC7WT in the absence or presence of ActD (1 nM). CTRL represents empty vector and DMSO treatment; β-actin was used as a loading control. (G) DNA content distribution analysis of samples analyzed in (F) shown as a bar diagram. Values above the bars indicate the percentage of cells with S-phase DNA content. (G) Representative of 3 independent experiments.

