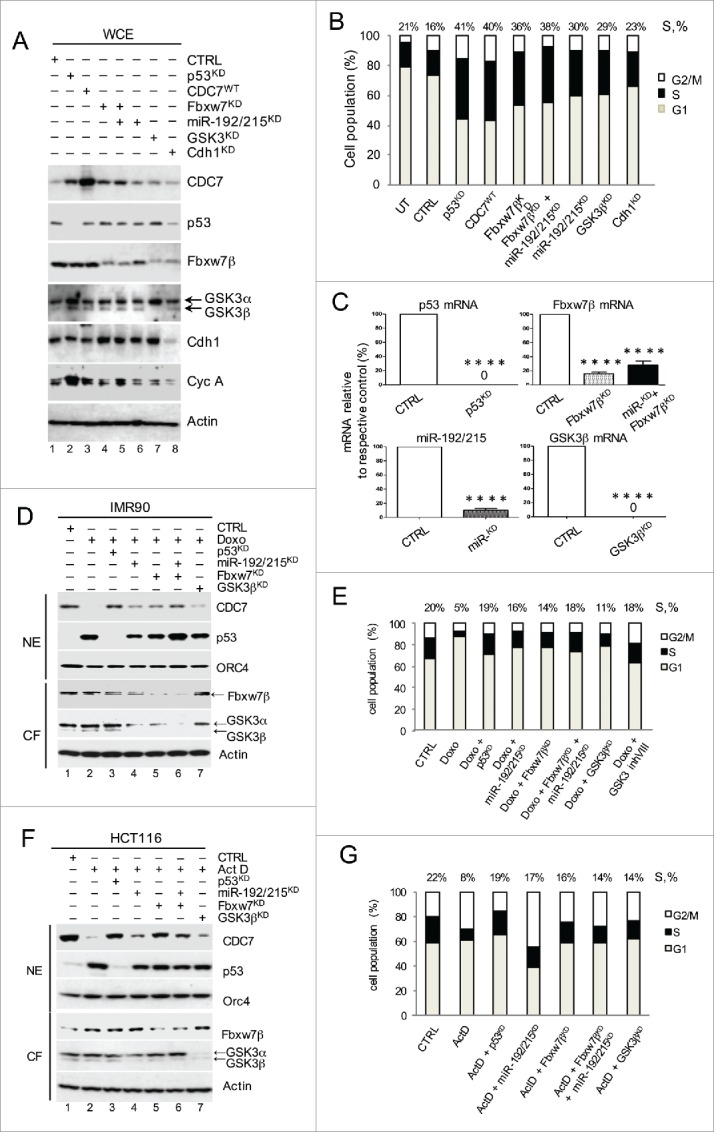
Figure 5.

Post-transcriptional and Post-translational p53-dependend Pathways Cooperate to Down-regulate CDC7 in Cells Undergoing DNA Damage. (A) Immunoblotting analysis of whole cell extracts (WCE) from IMR90 cells treated with either p53 siRNA, miR-192/215 siRNA, Fbxw7β shRNA, a combination of miR-192/215 siRNA and Fbxw7β shRNA, GSK3β siRNA or Cdh1 siRNA. β-actin was used as a loading control. (B) DNA content distribution analysis of indicated samples as described in (A) is presented as a bar diagram. Values above the bars represent the percentage of cells with S-phase DNA content. (B) Representative of 3 independent experiments. (C) Residual p53-, Fbxw7β-, miR-192/215- and GSK3β mRNA as measured by qRT-PCR in percentages (%) relative to the respective control (CTRL). (C) Mean ± SEM from 3 independent experiments (D) 2 μM Doxorubicin (Doxo) was added to IMR90 cells for 48h, after 24h pre-treatment with either p53 siRNA, miR-192/215 siRNA, Fbxw7β shRNA, a combination of miR-192/215 siRNA and Fbxw7β shRNA or GSK3β siRNA. CTRL represents the combination of non-targeting control siRNA and DMSO treatment. (E) DNA content distribution analysis of indicated samples as described in (D) is presented as a bar diagram. Values above the bars represent the percentage of cells with S-phase DNA content. (E) Representative of 3 independent experiments. (F) 1 nM Actinomycin D (ActD) was added to HCT116 cells for 24h, after 24h pre-treatment with following siRNAs: either p53 siRNA, miR-192/215 siRNA, Fbxw7β shRNA, a combination of miR-192/215 siRNA and Fbxw7β shRNA or GSK3β siRNA. CTRL represents the combination of non-targeting control siRNA and DMSO treatment. (G) DNA content distribution analysis of indicated samples as described in (F) is presented as a bar diagram. Values above the bars represent the percentage of cells with S-phase DNA content. (G) Representative of 3 independent experiments.
