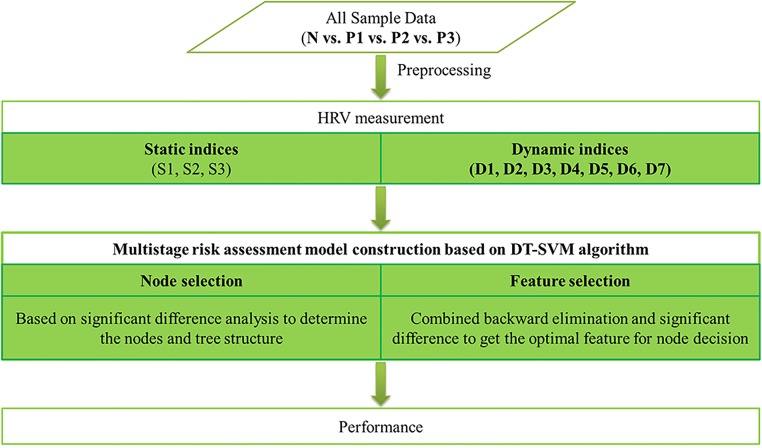
Fig 1. Flowchart of entire work.
N: normal people; P: CHF patients, in which 1 is of NYHA I-II, 2 is of NYHA III, 3 is of NYHA III-IV; S1: basic measures of 24-h RR interval data, which reflect long-term data variation); S2: basic measures of the second 5-min segment, which representing a stable measurement condition of short-term data; S3: mid-value of basic measures of 5-min segments, which showing an intermediate state of short-term data; D1: mean value of basic measures of 5-min segments, for robustness improvement; D2: standard deviation of each basic measure of 5-min segments; D3: root mean square of each basic measure of 5-min segments; D4: coefficient variation of each basic measure of 5-min segments; D5: percentage of abnormal value (value intervening M±S) of each basic measure of 5-min segments; D6: sample entropy of each basic measure of 5-min segments; D7: fuzzy entropy of each basic measure of 5-min segments.; DT-SVM: decision tree based support vector machine.

