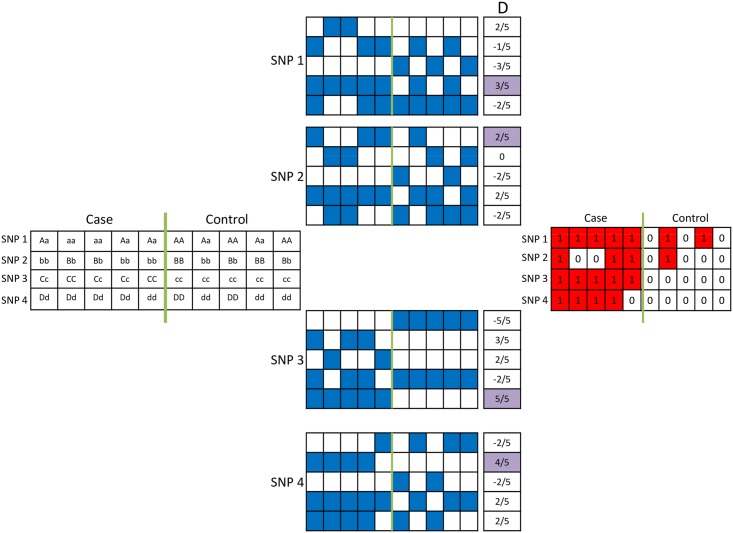
Fig 2. Model selection and computation of binary genotype profiles for each genomic locus.
The genotypes of four loci on a hypothetical case-control dataset are shown on the left. The five possible binary genotype profiles for each locus are computed, as shown in the middle. Blue squares indicate the presence of the genotype of interest in the respective sample for each model (respectively, homozygous minor allele, heterozygous, homozygous major allele, presence of minor allele, presence of major allele). The resulting binary genotype profiles for each locus are shown on the right. Red squares indicate the existence of genotype of interest according to the selected model. In this example, models m(4), m(1), m(5), and m(2) are respectively selected for the four loci.

