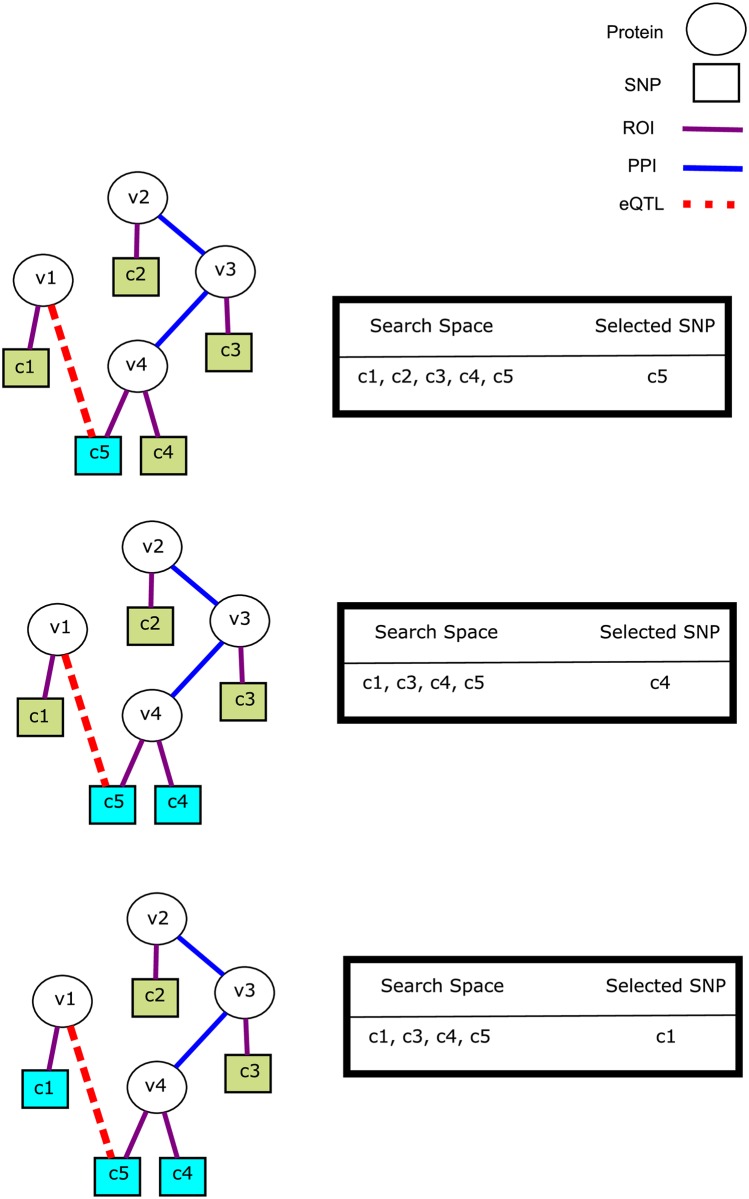
Fig 3. Identification of NetPocos.
Each vi represents a protein (V) and each cj represents a genomic locus (U). Blue edges represent the interactions between proteins (E), purple edges indicate that the respective locus is in the RoI of the coding gene for the respective protein and red edges represent the eQTL links. Initially, P is empty and all loci are considered and the locus (c5) that maximizes δ(.) is added to P. After this point, the search space is restricted to loci that are at most three hops away from c5. We continue this procedure until the set of selected loci cover a sufficient fraction of the case samples. Cyan nodes and gold nodes show the selected loci and proteins respectively.

