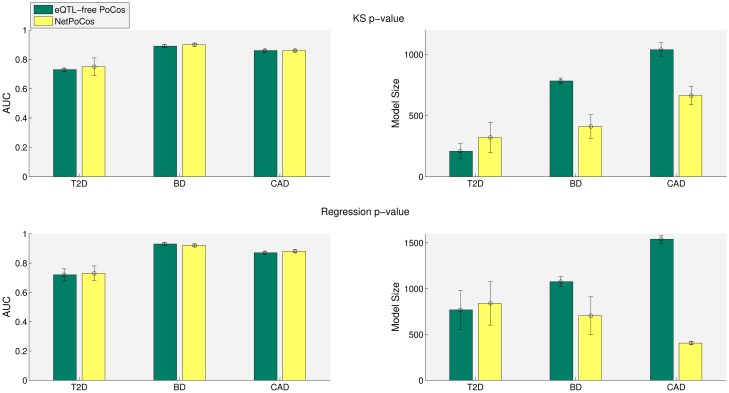
Fig 8. Comparison of the risk assessment performance of NetPocos (which include eQTL-based regulatory interactions and PPIs) and eQTL-free PoCos (which contain PPIs only) on T2D, BD and CAD.
PoCos are filtered based on KS p-value (first row) and regression p-value (second row). The colored bars show the average model size and AUC score and the error bars show the standard deviation of these figures across 5 runs.

