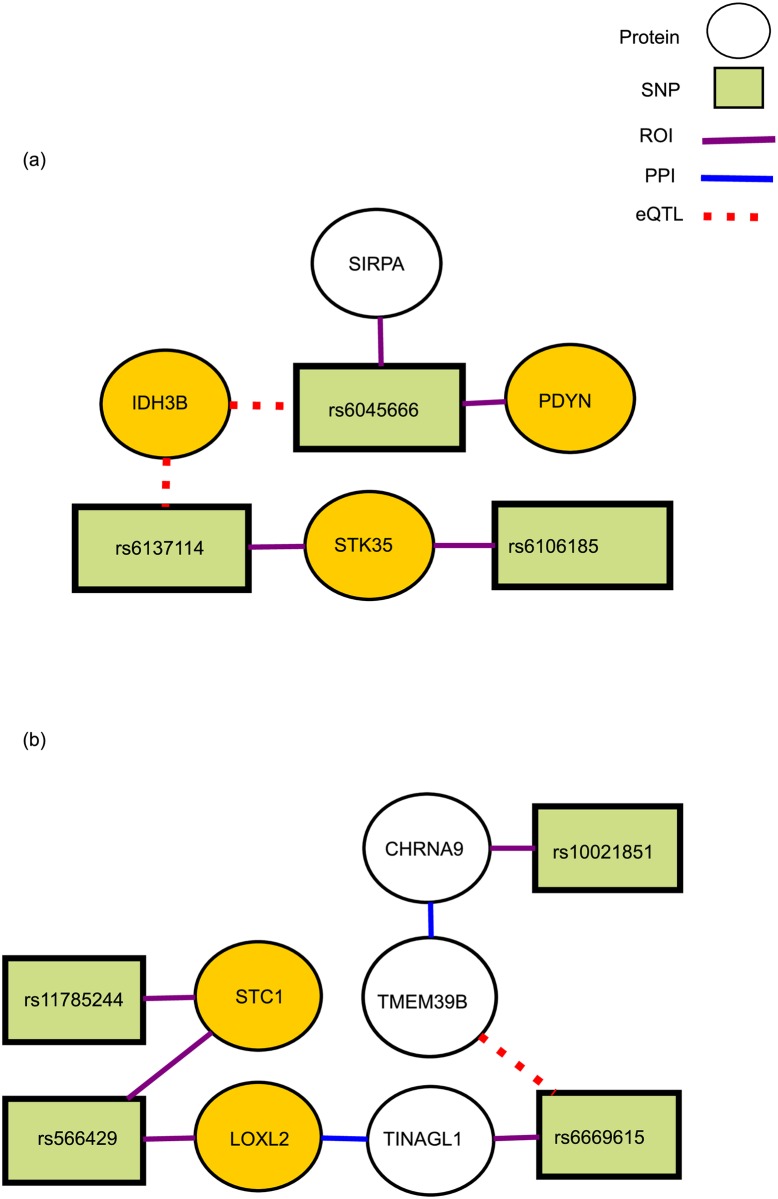
Fig 10. Two NetPocos associated with T2D.
Two NetPocos associated with Type II Diabetes (T2D). These NetPocos are consistently selected by L1 regularized logistic regression in the final model for risk prediction. The circle nodes represent proteins and rectangular nodes represent SNPs. Red dashed lines represent the eQTL association between a SNP and a gene, purple lines indicate that a SNP is in the ROI of the respective gene, and the blue edges represent a protein-protein interaction (PPI) between the products of respective genes. The genes that are previously reported to be associated with T2D are highlighted in gold. (a) A NetPoco enriched in isocitrate metabolic process and NADH metabolic process(p-value = 0.004), which both contribute to the amplification of insulin, (b) a NetPoco enriched in calcium ion homeostasis.

