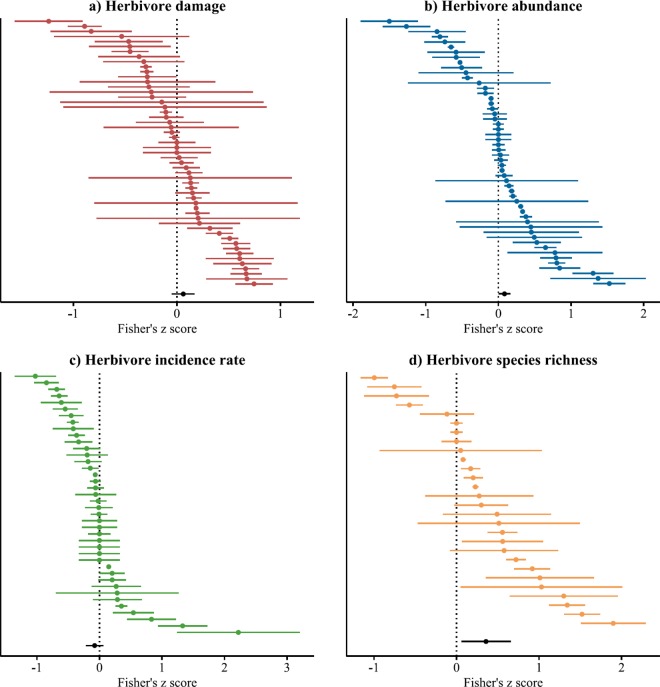
Fig 3.
Forest plots for the transformed correlation coefficients (Fisher’s z-scores) between tree diversity and a) the damage sustained by, b) the abundance of, c) the incidence rate of, d) the species richness of insect herbivores. Each point represents the Fisher’s z-score and the approximated confidence interval (= mean ± standard error × 1.96) for an individual study case. Negative values indicate associational resistance while positive values indicate associational susceptibility. Grand mean effect sizes, together with their 95% bootstrap confidence intervals, are shown in black at the bottom of each forest plot.

