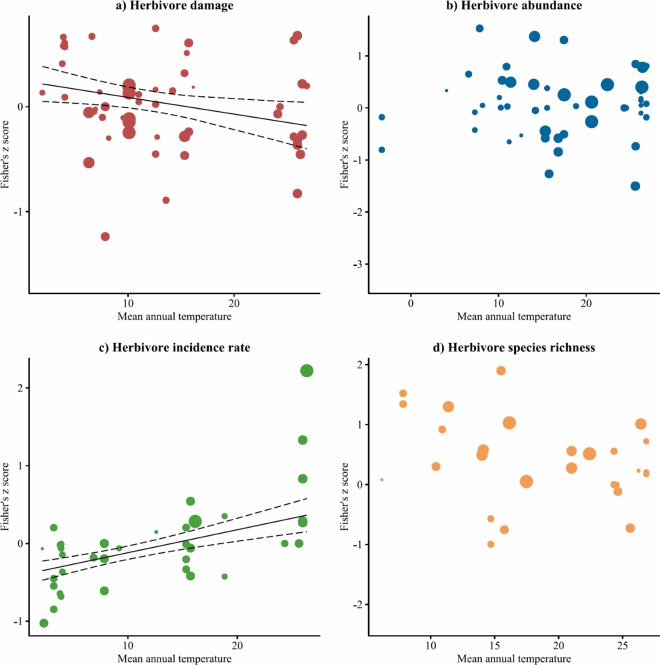
Fig 4.
Relationships between mean annual temperature (MAT) and the transformed correlation coefficients (Fisher’s z-scores) between the diversity of tree species and a) the damage sustained by, b) the abundance of, c) the incidence rate of, d) the species richness of insect herbivores. Each point represents an individual study case for which negative values indicate associational resistance while positive values indicate associational susceptibility. The size of each point indicates its weight for estimating the regression slope (solid line) and the corresponding approximated credible interval (dotted lines) in a mixed-effects meta-regression model. Coefficient estimates for MAT are reported in Table 1.

